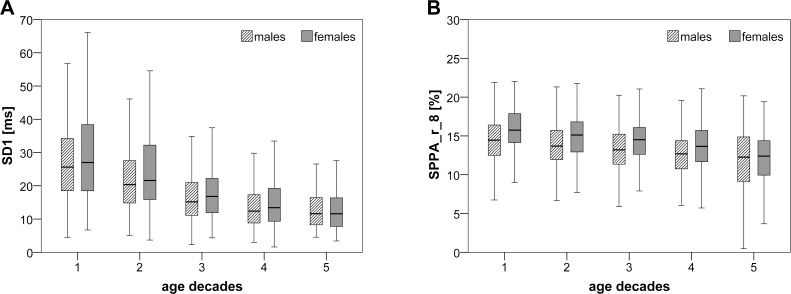
Fig 3. Box plots for SD1 and SPPA_r_8 for five investigated age decades divided by gender.
The box plots show two selected HRV indices (A: SD1 (PPA) and B: SPPA_r_8 (SPPA)) for the five investigated age decades (1: 25–34, 2: 35–44, 3: 45–54, 4: 55–64 and 5: 65–74 years) and divided into males (black cross-striped boxes) and females (white boxes). The boxes show the data between the 25th and 75 Percentile, the middle line represents the median.

