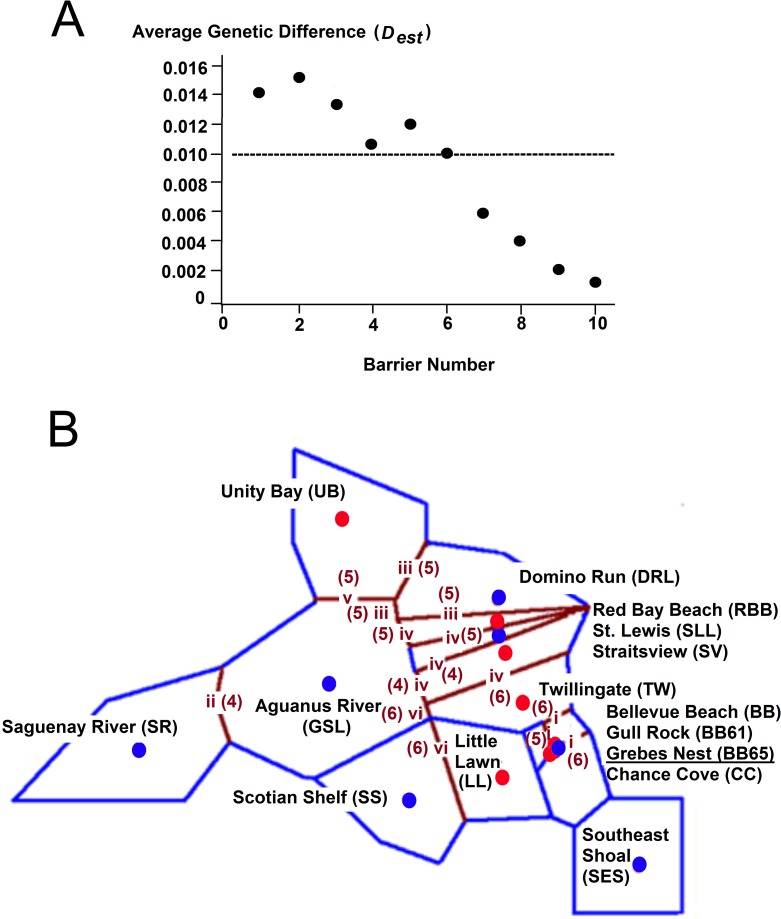
Fig 3. Spatial Genetic Structure.
A. The average genetic difference (Jost’s D est; Table 2) between the samples identified by each of 10 successive barriers. B. Genetic “barriers” to gene flow (numbered brown lines) among capelin calculated using the Monmonier algorithm from the overall Jost’s D est matrix (Table 2) based on samples from 15 locations. Blue lines illustrate the Voronoï tessellation. Filled circles represent the geographic position of samples identified through Bayesian clustering with Structure as belonging to Cluster I (blue) or Cluster II (red). Barriers are numbered sequentially in order of strength using Roman numerals. Six barriers are shown. Bracketed numbers represent the number of loci supporting the barrier (maximum 6). Barrier i surrounds the BB65 location.

