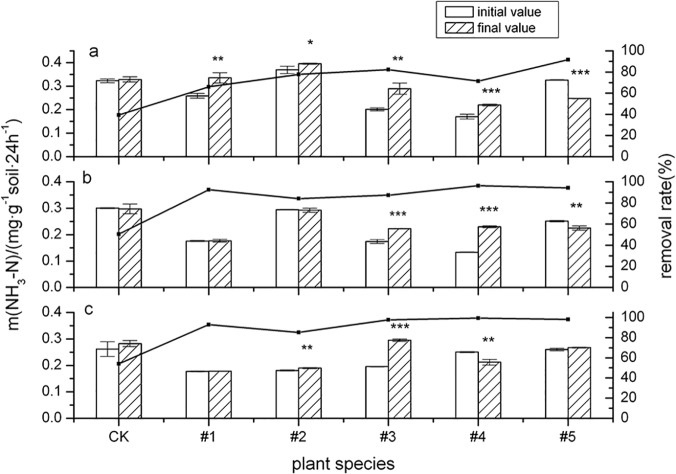
Fig 5. The activity of urease (URE) and its influence on ∑8PAHs degradation by five plant species over different time periods.
The error bars indicate the standard deviation of the means (n = 3). Symbols *, ** and *** indicate significant differences at p levels < 0.1, 0.05 and 0.01, respectively. (Different letters denote different periods: 60 days (a), 120 days (b) and 150 days (c).)

