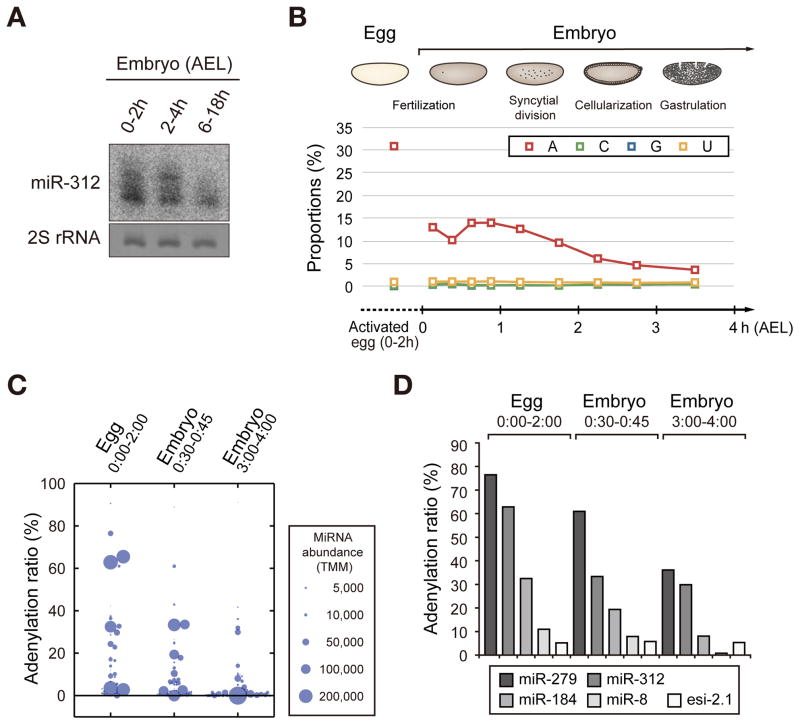
Figure 1. Adenylation of miRNA in Drosophila eggs and embryos.
(A) Northern blot showing the miR-312 expression pattern in Drosophila embryos. Long isomiRs are detected strongly in early embryos (0–4 h AEL) but not in later stage embryos (6–18 h AEL). (B) Small RNA sequencing from activated eggs and embryos at different time points. The modification ratio is calculated by dividing the modified miRNA reads by total miRNA reads. Nontemplated C, G, U additions are constantly rare throughout development, while adenylation ratio is specifically high in eggs and early embryos. (C) A dot plot showing the adenylation rate of individual miRNA species in indicated time frames. The size of the circle reflects trimmed mean of M-values (TMM) which is the normalized abundance of miRNA by total miRNA read count. Ninety two miRNA species were analyzed (TMM > 100 in at least one of the three samples). (D) Adenylation of representative small RNAs in deep sequencing data at different developmental stages. Adenylation frequency of endo-siRNA 2.1 is relatively low and constant, which contrasts with those of miRNAs. See also Figure S1, Table S1 and Table S2.

