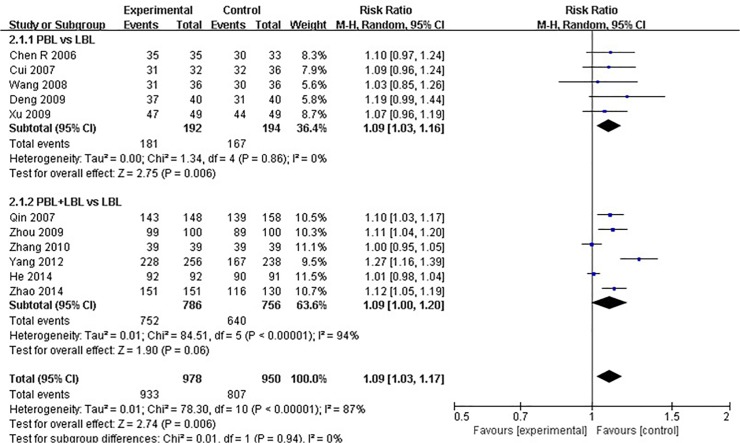
Fig 2. Forest plot of PBL experimental group and LBL control group course pass rates (random effects model).
Events: “pass” events, M-H: Mantel-Haenszel, PBL:PBL teaching model independently applied to the experimental group, PBL+LBL: PBL+LBL teaching models applied to the experimental group, LBL: LBL teaching model applied to the control group.

