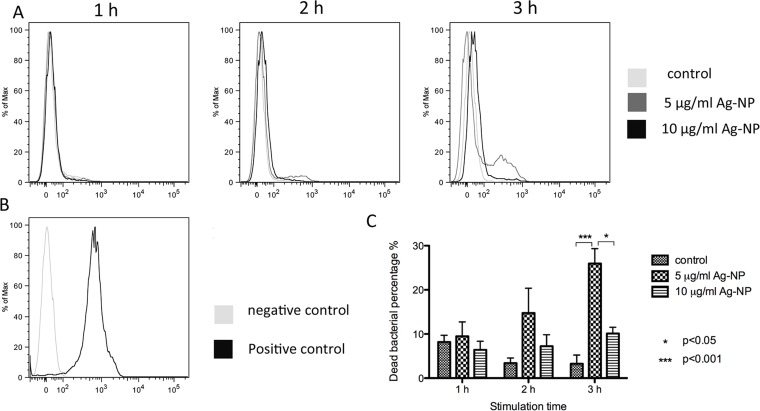
Fig 3. The analysis of dead ratio in bacterial cells by flow cytoometric.
A. Flow cytometric analysis for dead bacterial percentage using PI staining. B. Flow cytometric analysis control: negative control using bacteria shaken 1h without any treatment and positive control using bacteria co-cultured with 70% isopropanol. C. statistic analysis by one way ANOVA test and Tukey’s multiple comparison test. (n = 3).

