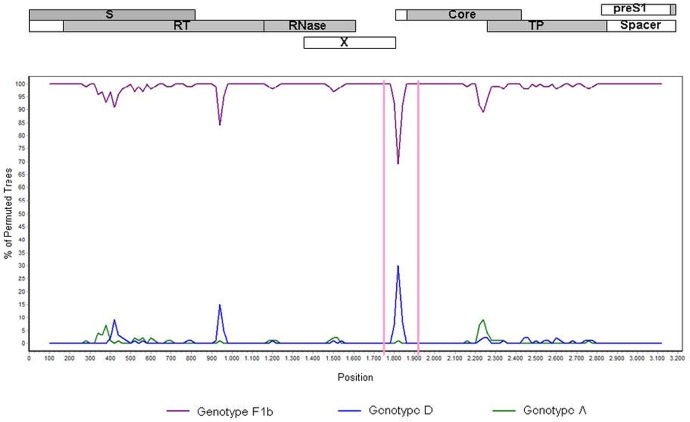
Fig 2. Bootscan plot.
Nucleotide similarity comparison between genotype F4 against genotypes F1b (violet line), D (blue line) and A (green line). The graph was generated using Simplot ver. 3.5.1 with window size 200 bp, step size 20 bp, gap-strip off, 100 bootstrap replicates, Kimura transition/transversion ratio:2 and neighbor-joining. The genomic regions are shaded in gray on the top of the figure, which shows the genomic arrangement of the HBV open reading frames. Numbers on the x axis denote nucleotide positions from the start of EcoR1 restriction site.

