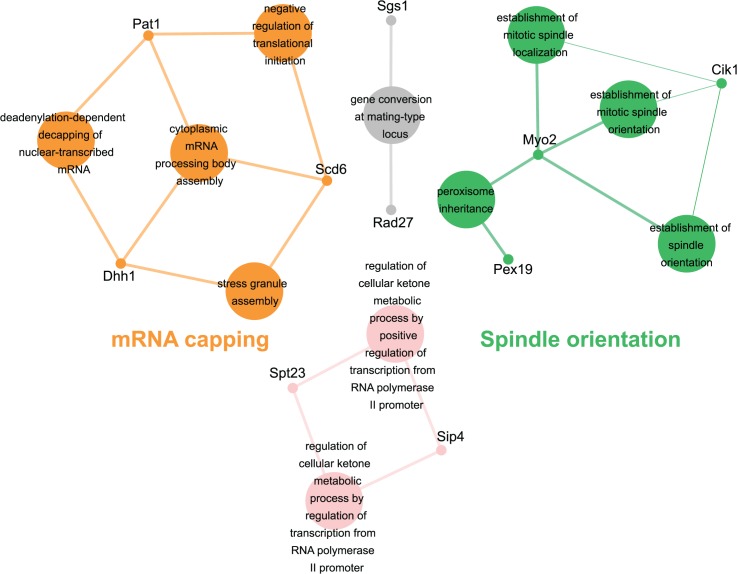
Fig 2. esp1-1 functional interaction map derived from the SDL screen.
The 44 genes identified in the esp1-1 SDL screen were subjected to Cytoscape analysis. All nodes are significantly enriched (p <0.05) GO Terms in the dataset and coloured nodes represent GO Terms that have been grouped into a significantly enriched category. Grey nodes are GO Terms that were not grouped into an enriched category. Edges define associations between groups and edge thickness indicates the level of significance within the network. Genes identified in the SDL screen that are associated with GO Terms are shown.

