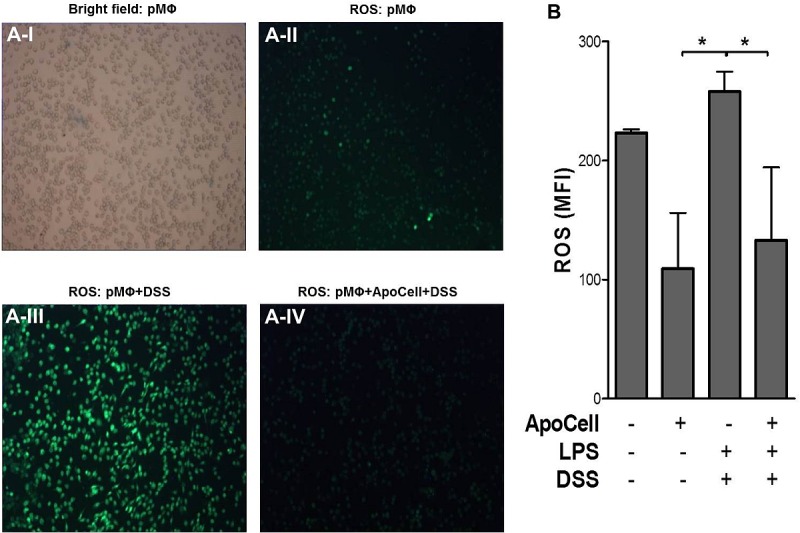
Fig 6. Reactive oxygen species (ROS) in pMΦ.

(A) Upper Panel: I. pMΦ as seen in bright field. II. pMΦ seen by fluorescent microscope following incubation with an ROS-sensitive dye (1μM). III. pMΦ following 3% DSS treatment. Generation of ROS is seen. IV. pMΦ following 3% DSS and apoptotic cell treatment. Inhibition of ROS generation is seen. Original magnification: All panels x100. pMΦ extracted from mice were seeded overnight onto eight-chamber slides at a density of 1x10⁵ cells/chamber. After washing, pMΦ were treated for 2h with apoptotic cells followed by treatment with 3% DSS for 30 min. Negative control samples were treated with media only. ROS generation was determined by fluorescence microscopy using a fluorescein fluorescent probe for 30 min with a green filter. The experiments were repeated 3 times, independently; one representative experiment is shown. (B) Flow-cytometer analysis of pMΦ stained with ROS-sensitive dye. ROS generation was determined by flow-cytometer using a fluorescence probe as above, excluding dead cells base on FSC/SSC parameters. Shown are means ± SEM of 3 experiments done in triplicates (*p<0.05, one way ANOVA).
