
Figure 2.
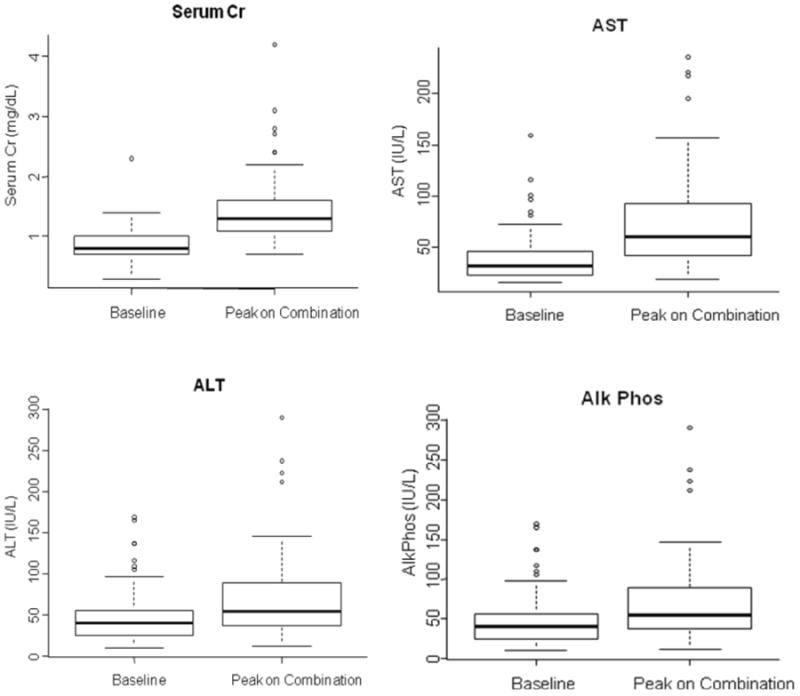
Boxplots that illustrate the difference in serum creatinine (2.A), ALT (2.B), AST (2.C) and Alk Phos (AP) (2.D) at baseline and during voriconazole coadministration. The squares represent the interquartile range (IQR). Capped whiskers represent the upper and lower adjacent values.