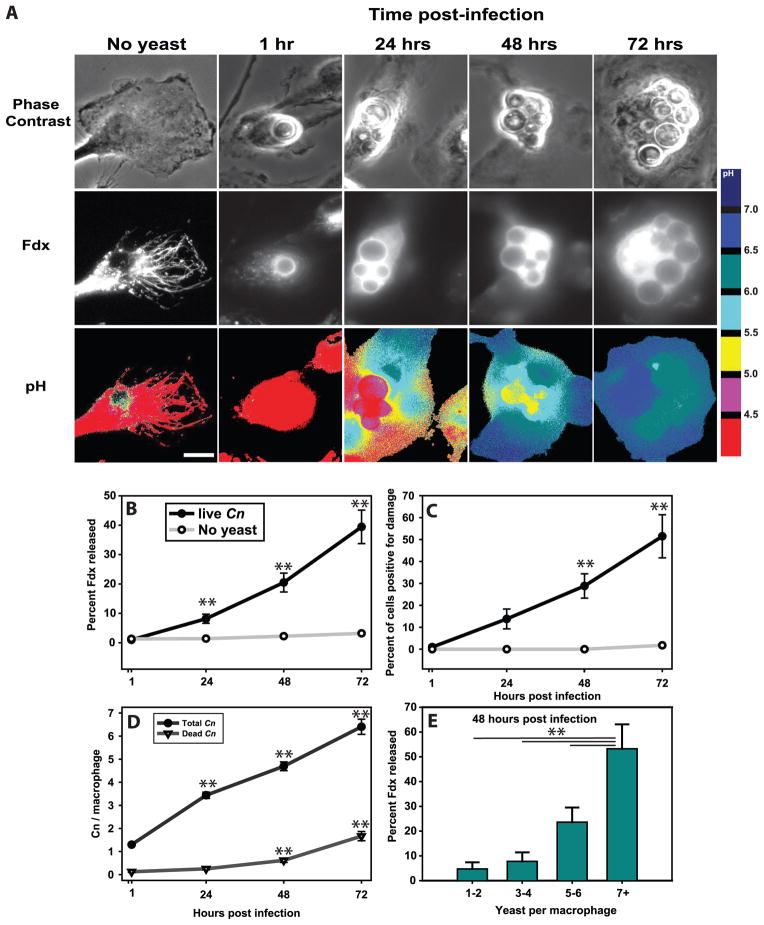
Figure 1. Cryptococcus neoformans induces lysosome damage that increases over time and with yeast replication.
BMM lysosomes were loaded with Fdx during overnight incubation followed by 3 hours of chase in Fdx-free media. BMM were then infected with IgG-opsonized Cn strain H99. After one hour, excess yeast were rinsed away and cultures imaged immediately (1h post infection) or at 24, 48 and 72 hours post infection. (A) Representative images showing the phase contrast of macrophages and internalized Cn (top), Fdx distribution pattern within macrophages (middle) and pH maps, pseudo-colored such that each color represents a defined range of pH (bottom; pH color key is displayed to the right of the images). Scale bar in lower right represents 10 μm. (B) Average lysosome damage, quantified as the percent of Fdx released from the lysosome into the cytosol. (C) The data from B re-plotted as the percent of cells positive for lysosome damage (release greater than 10%). For B & C statistical comparisons are between infected and uninfected macrophages at each time point and between indicated time points and live Cn containing cells at the 1 hr post infection time point. One symbol was displayed for each time point since both comparisons resulted in similar p values. (D) Mean number of total and dead Cn per analyzed macrophage. Statistical comparisons are between indicated time points and the 1 hr post infection time point. (E) Mean lysosome damage as a function of number of Cn per macrophage at 48 hours post-infection time point. Note that lysosome damage, the number of Cn and the number of killed Cn increased over the course of the experiment. Data are mean ± SEM and are combined from two independent experiments (total analyzed macrophages per time point n >100). For (B, D & E) ** indicates p<0.005, Student-Newman-Keuls.

