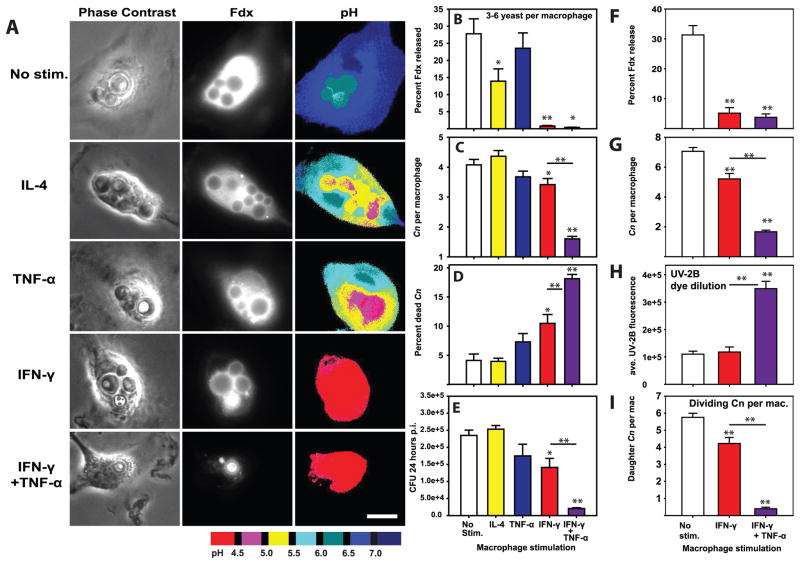
Figure 7. IFN-γ-stimulation of macrophages prevents C. neoformans-mediated lysosome damage and restricts C. neoformans replication.
BMM were stimulated with 20 ng/mL IL-4, 20 ng/mL TNF-α, 100 ng/mL IFN-γ or 100 ng/mL IFN-γ plus 20 ng/mL TNF-α for 24h prior to infection with Cn. 24 hrs post-infection, Cn-containing BMM were analyzed for lysosome damage (A & B), the number of yeast per BMM (C) and the percent of dead Cn per macrophage (D). In A scale bar in lower right represents 10 μm. (E) In parallel experiments BMM were similarly stimulated and infected with Cn. The cultures were lysed 24 hours post infection and colony forming units enumerated. In B–D, N > 90 total analyzed macrophages in each condition combined from three independent experiments. In E, N = 6 wells combined from two independent experiments. A similar experiment was performed using BMM stimulated with 100 ng/mL IFN-γ or 100 ng/mL IFN-γ plus 20 ng/mL TNF-α for 24h prior to infection with uvitex-2B-stained Cn. 48 hours post infection, Cn-containing BMM were imaged and analyzed for lysosome damage levels (F), number of Cn per BMM (G), Intensity of Uvitex-2B staining in Cn (H) and the number of Cn per macrophage with dim Uvitex-2B staining indicating replicated Cn (I). In F–I, and are combined from 2 independent experiments. In N > 60 total analyzed macrophages in each condition. Bar graphs are mean ± SEM. Statistical comparisons not indicated by lines are to no-stimulation controls; comparisons between IFN-γ and IFN-γ + TNF-α conditions are indicated by lines. * indicates p<0.05 and ** indicates p<0.005 Student-Newman-Keuls.

