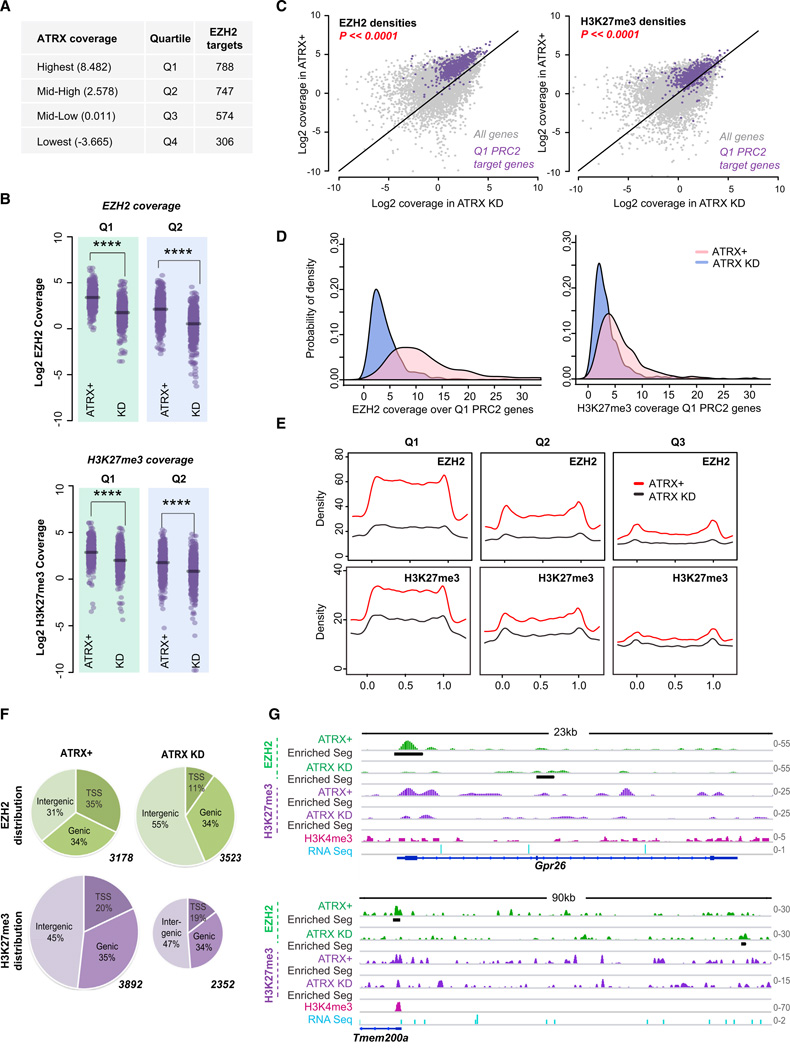
Figure 6. Global Roles of ATRX in Regulating PRC2 Localization and Function.
(A) RefSeq genes (21,677) divided into equal quartiles (Q1-Q4) based on ATRX coverage. Average ATRX coverages and number of EZH2 target genes (peaks) in each quartile are shown.
(B) Dot plots showing Log2 densities of EZH2 and H3K27me3 in ATRX+ versus ATRX KD MEFs for each quartile. ****p ≪ 0.0001, as calculated by the Student’s t test.
(C) Scatterplot of EZH2 and H3K27me3 densities in Log2 scale overall genes (gray dots) and Q1 PRC2 target genes (purple dots) in ATRX+ or ATRX KD MEFs. The difference between ATRX+ and ATRX KD cells of Q1 PRC2 target genes is highly significant (p < 2.2 × 10⁻¹⁶, Student’s t test) for both epitopes.
(D) Probability density function for EZH2 and H3K27me3 based on coverages over the Q1-PRC2 target genes in the indicated MEF samples.
(E) Metagene profiles of EZH2 (top) and H3K27me3 (bottom) coverage. The metagenes are scaled 0 to 1 from genie start (TSS, x = 0) to end (TTS, x = 1).
(F) Distribution of EZH2 and H3K27me3 peaks in indicated MEF samples. Peaks are categorized as TSS (+/— 3Kb), genie, or intergenic. Total number of peaks called for each data set is indicated next to each chart.
(G) ChIP-seq tracks showing EZH2 and H3K27me3 densities in ATRX+ and ATRX-KD MEFs. Black bars, significantly enriched segments. H3K4me3 (pink) and RNA Seq (blue) tracks are as published (Yang et al., 2010; Yildirim et al., 2012).

