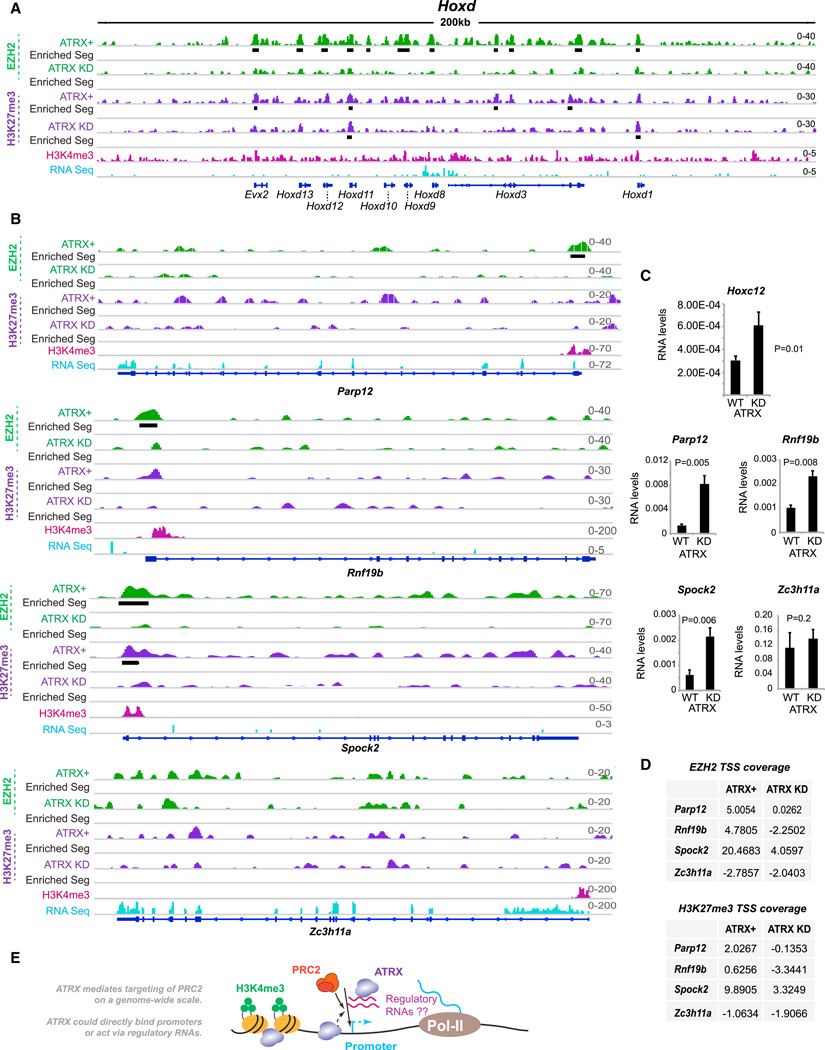
Figure 7. Loss of EZH2 from Target Genes as a Result of ATRX Knockdown Results in Activation of These Genes.
(A, B) Left panel: ChIP-seq tracks of the Hoxd cluster (A) or individual genes (B) showing EZH2 and H3K27me3 patterns in ATRX+ and ATRX-KD MEFs. Black bars, statistically significant enriched segments. H3K4me3 (pink) and RNA Seq (blue) tracks were previously published (Yang et al., 2010; Yildirim et al., 2012).
(C) qRT-PCR analysis of expression levels before and after ATRX KD. Averages and SE of three independent experiments shown with Student’s t test P values.
(D) EZH2 and H3K27me3 coverages over TSS before and after ATRX KD.
(E) Model: ATRX-dependent targeting of PRC2 on a genome-wide scale. ATRX mediates targeting either by directly binding DNA, or via regulatory RNAs such as those in the PRC2 interactome.

