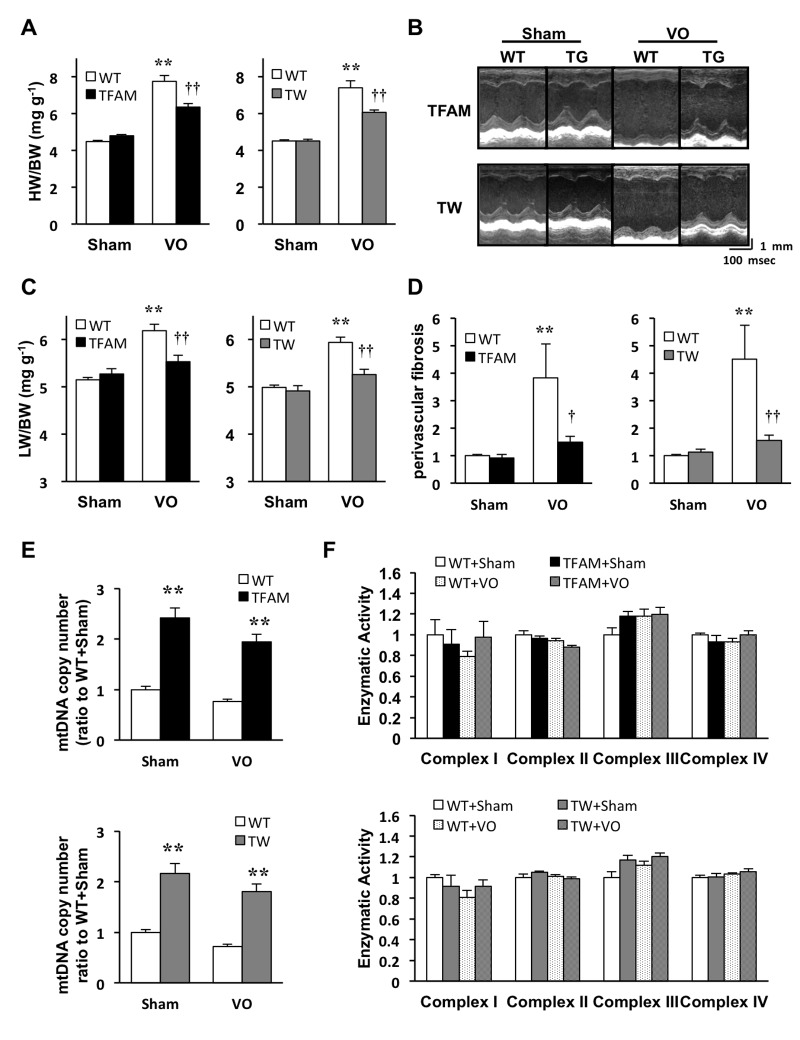
Fig 2. Analysis of TFAM and Twinkle (TW) mice 8 weeks after arteriovenous fistula creation.
(A) Heart weight/body weight (HW/BW) (n = 12) (B) M-mode echocardiogram (C) Lung weight/body weight (LW/BW) in TFAM and TW mice (n = 12). (D) Quantification of perivascular fibrosis standardized by vascular circumference (n = 6). (E) mtDNA copy number in left ventricle (LV) of TFAM (upper panel) and TW (lower panel) mice (n = 6). (F) Mitochondrial electron transport chain enzymatic activities in TFAM (upper panel) and TW (lower panel) mice (n = 4–5). Data are expressed as mean ± SEM. *P < 0.05 vs. WT + Sham, **P < 0.01 vs. WT + Sham, † P < 0.01 vs. WT + VO, †† P < 0.01 vs. WT + VO, analyzed by one-way ANOVA followed by post hoc Tukey’s test.

