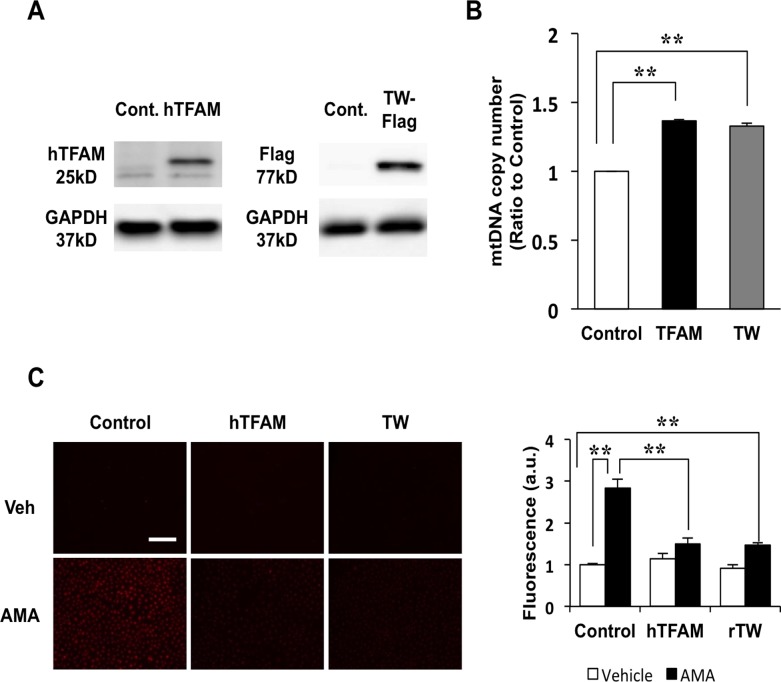
Fig 6. Mitochondrial reactive oxygen species (mitoROS) assay using H9c2 overexpressing human TFAM (hTFAM) or rat Twinkle-Flag (rTwinkle) and mitochondria from TFAM mice and Twinkle (TW) mice.
(A) Protein expression of hTFAM in H9c2 overexpressing hTFAM (left panel) and rTwinkle-Flag in H9c2 overexpressing rTwinkle (right panel). (B) Quantification of mtDNA copy number in H9c2 overexpressing hTFAM and rTwinkle by real-time PCR, (C) Antimycin A-induced mitoROS using MitoSOX probe in H9c2 overexpressing hTFAM and rTwinkle, Scale bar, 50 μm (upper panel). Quantification of fluorescence-intensity in the cytoplasm of H9c2 cells overexpressing hTFAM or rTwinkle vs. controls (lower panel; n = 3). Data are expressed as mean ± SEM. *P < 0.05, **P < 0.01, analyzed by one-way ANOVA followed by post hoc Tukey’s test.

