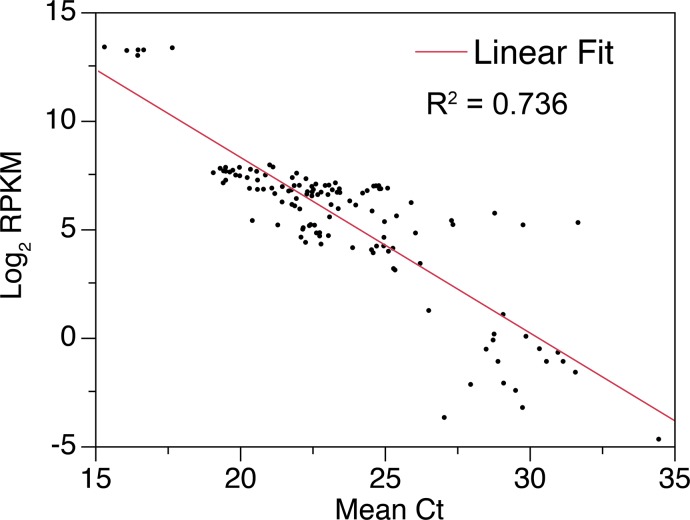
Fig 1. Comparison and correlation of the relative expression of selected genes as determined via RNA-seq (RPKM) and qRT-PCR.
qPCR ct values are the mean of 3 replicates. ct values were determined using the delta-delta method. The GBAS (glioblastoma amplified sequence) gene was used to normalize the qPCR data for cDNA input.

