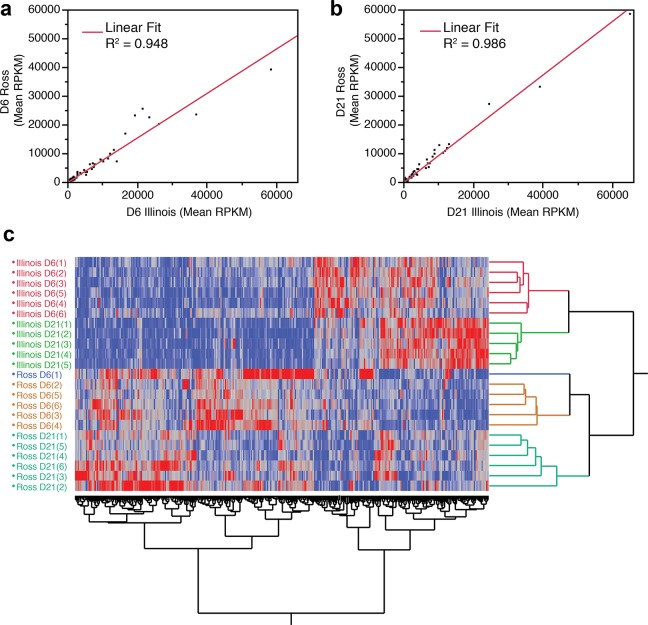
Fig 2. Scatter plot comparison of the expression level (in RPKM) of all genes between Ross 708 and Illinois lines on (A) post-hatch day 6 and (B) post-hatch day 21. (C) Hierarchical clustering of all significantly differentially expressed genes.
(A&B) The expression levels of all 15,945 analyzed genes were compared for each time point in both lines, the line of best fit and R2 values are included. C) Hierarchical clustering was performed on 366 genes determined to be differentially enriched in at least one condition. Dendrograms are in a distance scale.

