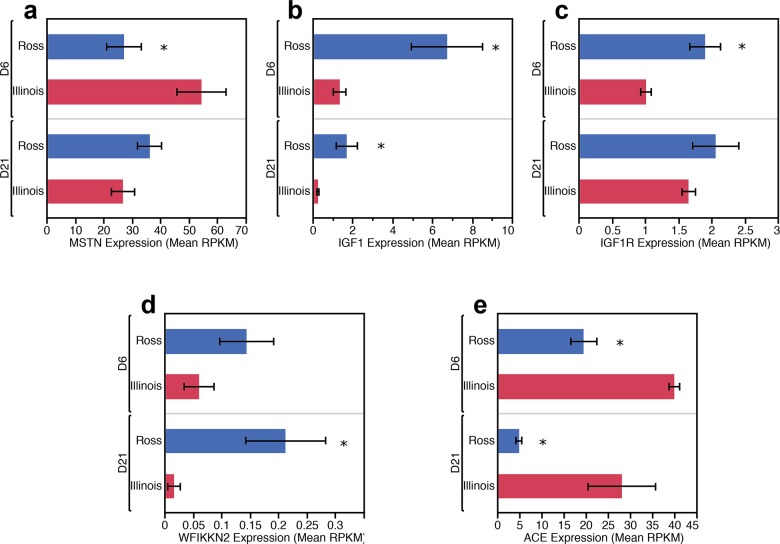
Fig 4. Expression levels, in mean RPKM, of major myogenic growth regulators differentially enriched between Ross 708 and Illinois breast muscle samples.
Expression level is the mean RPKM of a given gene for each condition. Error bars represent 1 SEM. Ross 708 D6 n = 6, Illinois D6 n = 6, Ross 708 D21 n = 6, Illinois D21 n = 5. * indicates significant at p < 0.05

