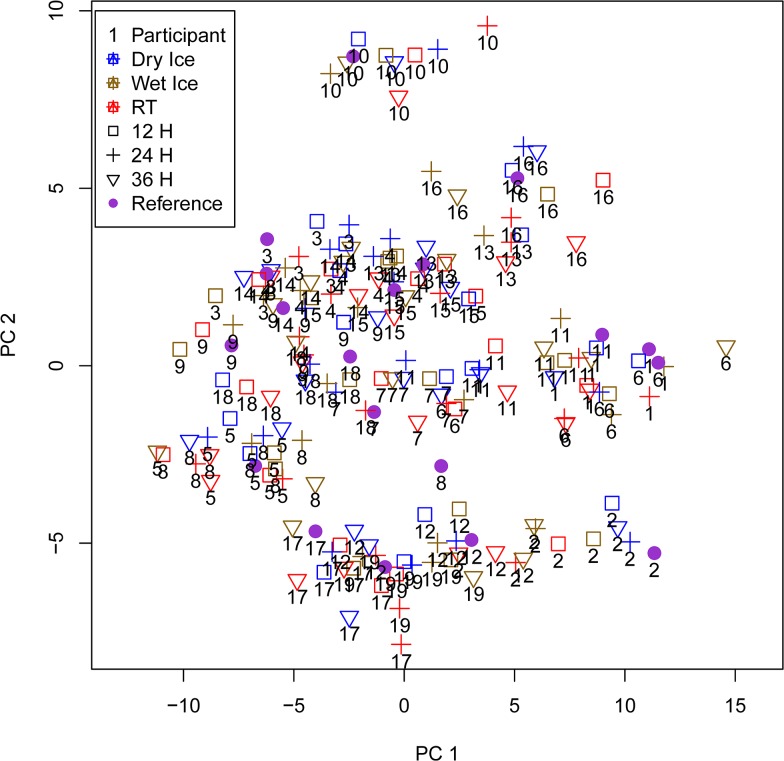
Fig 3. Principal component analysis (PCA) of metabolite concentrations.
Projecting all samples from each participant treated by different pre-storage handling conditions on the first two principal components of the PCA based on all metabolite concentrations shows that samples from one participant cluster together in spite of different pre-storage handling conditions. Reference samples (immediately frozen in liquid nitrogen) are depicted by violet circles.

