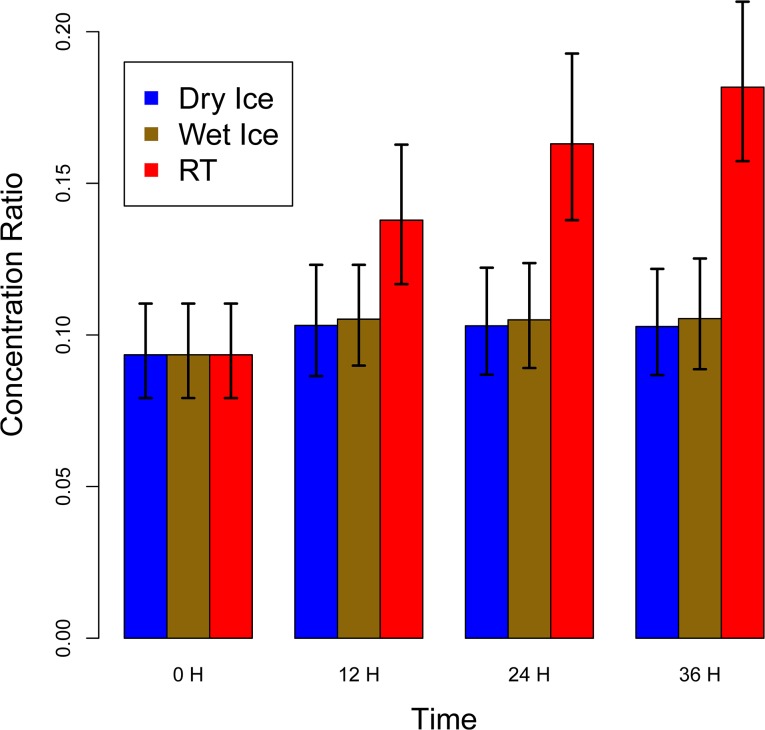
Fig 5. Ratio of total lysophosphatidylcholines to total phosphatidylcholines.
The displayed concentration values represent the mean of the samples of all 19 participants at the respective pre-analytical condition. The error bars represent one standard deviation based on the 19 measurements. The rof total lysophosphatidylcholines to total phosphatidylcholines (tLyso/tPC) in samples treated by different pre-storage handling conditions increases with time during RT treatment.

