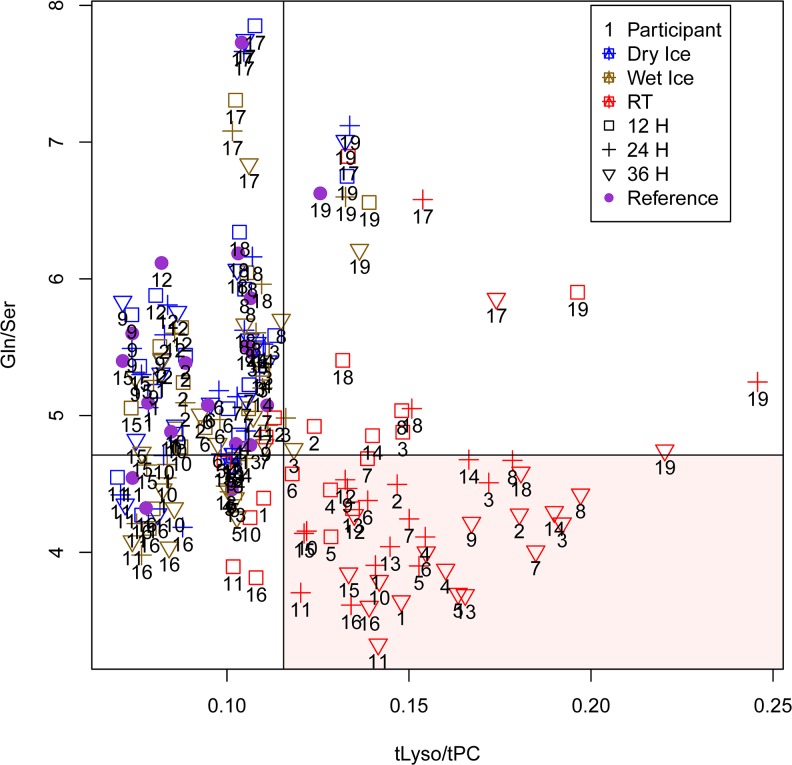
Fig 6. Metabolite concentration ratios for classification of sample quality.
Plot of the two metabolite concentration ratios selected by the classification tree out of the 10 most important variables for classification (Fig 4), shown for all samples under different pre-storage handling conditions; cut-off values from the classification tree are shown as horizontal/vertical lines, the red area indicates samples classified as ‘bad’ pre-analytical quality by the classification tree; three samples from the training set (24 and 36 h RT samples of participant Nr. 19, 24 h RT sample of Nr. 18) and two from the test set (24 and 36 h RT of Nr. 17) are wrongly classified as good, giving a misclassification rate of 0.042 on the training set (12 participants) and 0.048 on the test set (7 participants).

