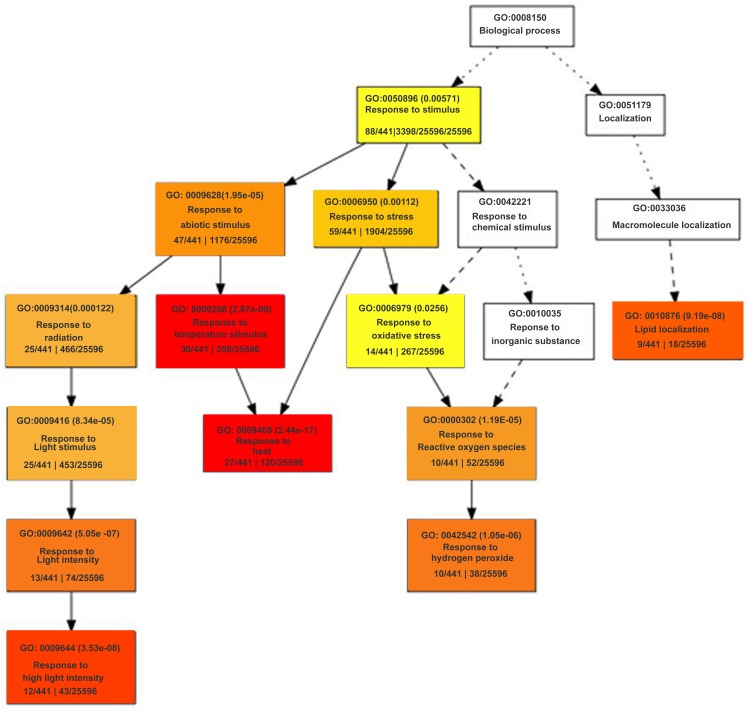
Fig 4. Hierarchical tree graph of over-represented GO terms in down-regulated genes by singular enrichment analysis generated by agriGO.
Boxes in the graph show GO terms labelled by their GO ID, term definition and statistical information. The significant terms (adjusted P<0.05) are marked with color, while non-significant terms are shown as white boxes. The degree of color saturation of a box correlates positively with the enrichment level of the term. Solid, dashed and dotted lines represent two, one and zero enriched terms at both ends connected by the line, respectively. The rank direction of the graph runs from top to bottom.

