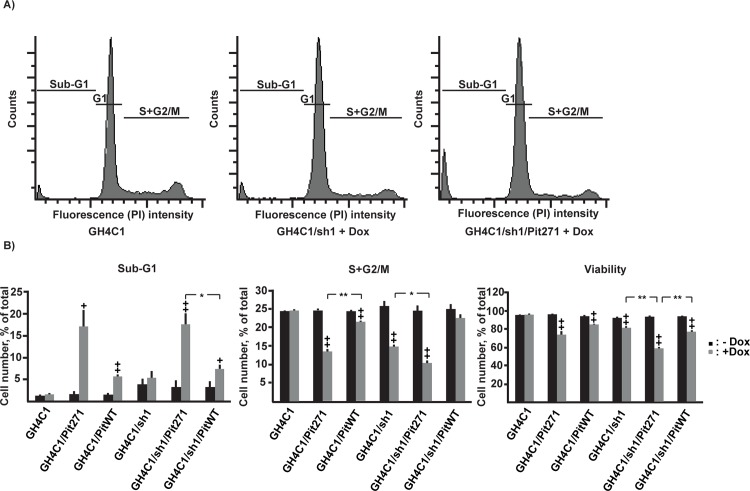
Fig 4. Flow cytometer analysis of the different cell populations in the absence or presence of 1 μg/ml doxycycline for 5 days.
A. Representative examples of histograms based on DNA content showing the decrease of the proportion of the S+G2/M population upon induction of shRNA or PIT271, with the concurrent increase in the sub-G1 population in the latter case. B. Quantitative analysis of the different sub-populations. Results (mean ± SEM) are pooled from four independent experiments, with duplicate measures in each. +: p<0,05, ++: p<0.01, relative to the same population without doxycycline, *: p<0,05, **: p<0,01.

