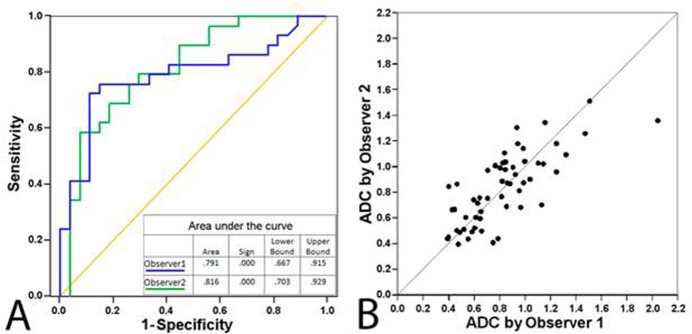
Fig 4. The ADC readings were congruent between observers (A) and (B).

Receiver operating characteristics (A) and scatter plot (B) of readings from two observers (n = 56) with ROIs including information of the mean, standard deviation, minimum, and maximum values. Diagonal segments result from ties.
