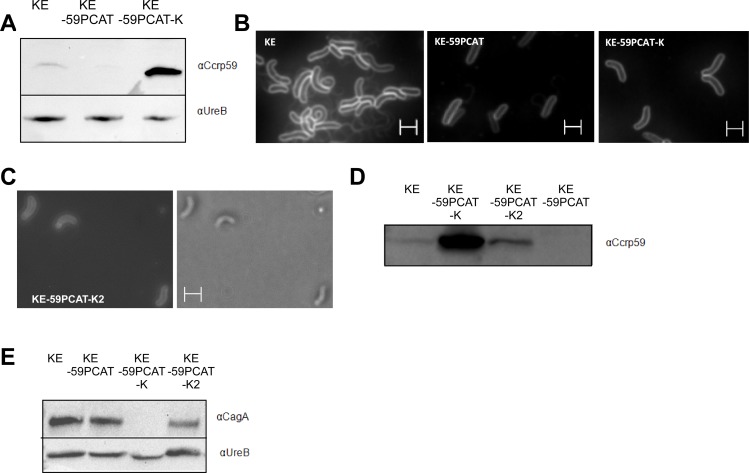
Fig 2. A) Western blot using Ccrp59 specific antiserum, strains as indicated above the lanes.
Equal amounts of protein were loaded onto each lane. B) Fluorescent micrographs of FM4-64 membrane stained cells of KE88-3887 (KE) wild type, KE-59PCAT and KE-59PCAT-K. C) DIC and fluorescent micrographs of FM4-64 membrane stained cells KE-59PCAT-K2. D) Analysis of Ccrp59 production in KE88-3887 (KE) wild type, KE-59PCAT, KE-59PCAT-K and KE-59PCAT-K2 using Ccrp59 specific antiserum Equal amounts of protein were loaded onto each lane. E) Western blot analysis of CagA in KE88-3887 (KE) wild type, KE-59PCAT, KE-59PCAT-K and KE-59PCAT-K2. White scale bar 2 μm.

