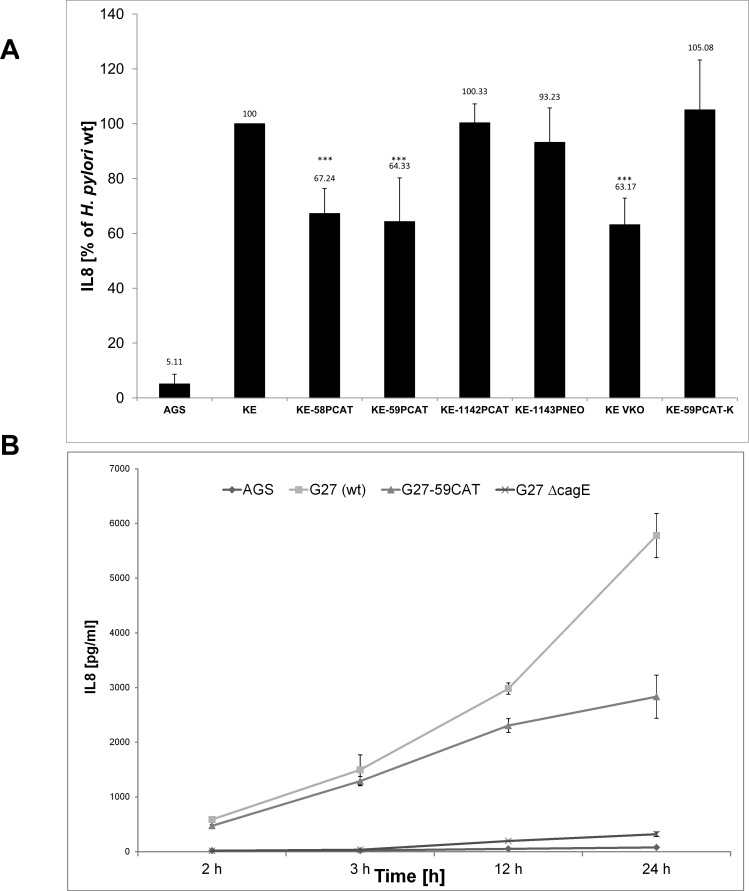
Fig 4. A) AGS cells were co-cultured with H. pylori wild type (KE) or the indicated mutants, and IL-8 production was analyzed by ELISA as described in Methods.
Results shown are the averages of four independent experiments and expressed as a percentage relative to wild-type (set at 100%; no error bar); error bars denote standard deviations. Exact percentage values are indicated above the bars. Three asterisks indicate a significant difference with a P value below 0.001 as determined by Student's t test. B) Kinetics of IL-8 production shown as absolute values of H. pylori wild type (G27), ccrp59 mutant (G27-CAT) and cagE mutant (G27ΔcagE), respectively; error bars denote standard deviations.

