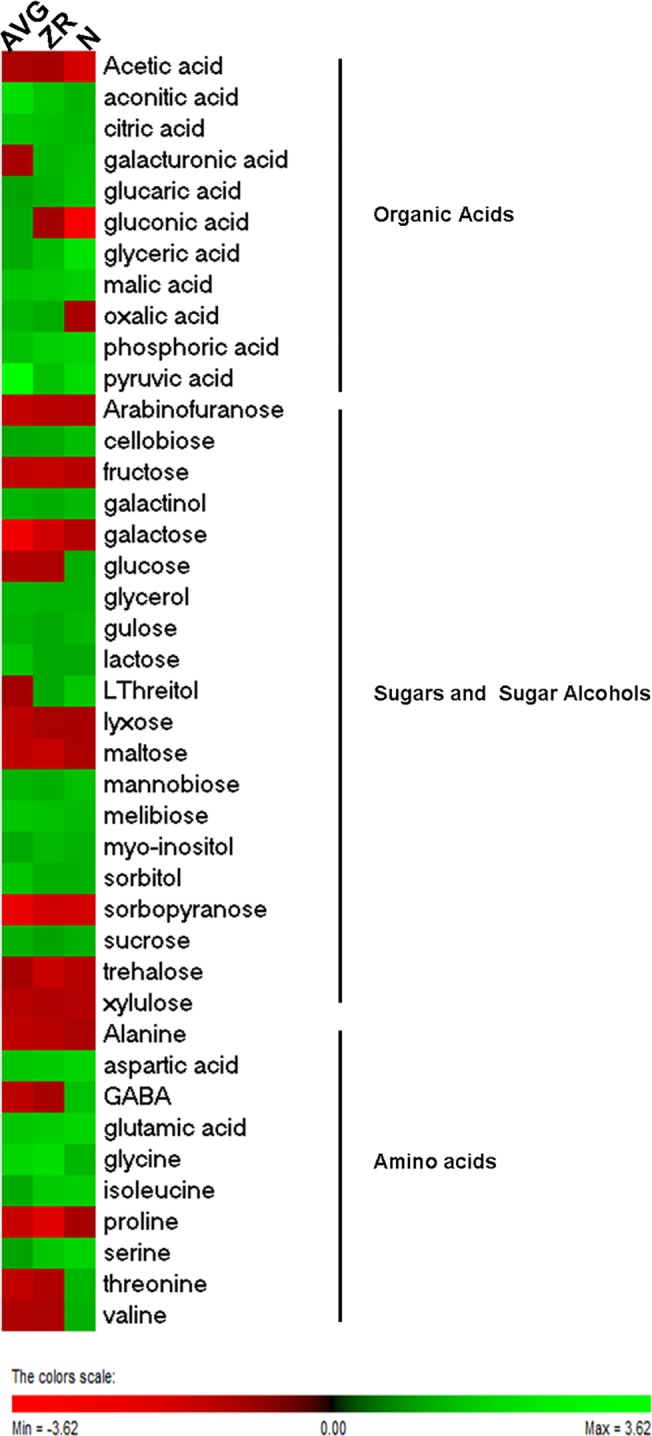
Fig 2. Heat map of changes in metabolite levels in AVG, ZR, and N-treated plants at 28-d heat stress compared to the control.

Heat map showing the fold change of each metabolite for AVG, ZR, and N-treated plants when compared against the control at 28-d Heat stress. Green indicates an increase in metabolite fold number or up-regulation, and red indicates a down-regulation of a specific metabolite compared to the control.
