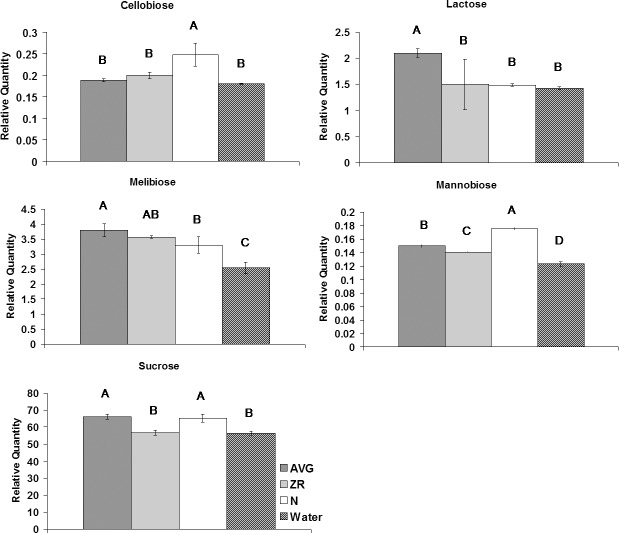
Fig 4. Disaccharide levels during heat stress for AVG, ZR, and N-treated plants, and the water-treated control.
Relative quantities of disaccharides at 28-d heat stress for AVG, ZR, and N-treated plants, and the water-treated control. Error bars indicate standard deviations and letters are statistical groups according to Fisher’s protected LSD (p = 0.05), with groups not containing the same letter being significantly different. Only metabolites which had at least one group significantly different from the others are presented.

