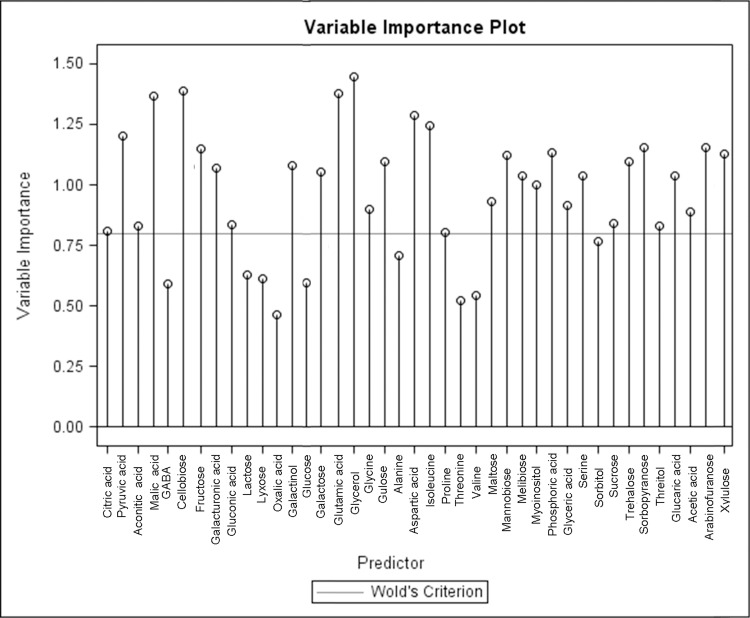
Fig 9. Variable importance plot of metabolites during heat stress.
Variable importance projection plot generated from the partial least squares regression highlighting which metabolites may potentially play a larger role in heat tolerance as predicted by the model. Wold’s citerion is denoted by a horizontal line.

