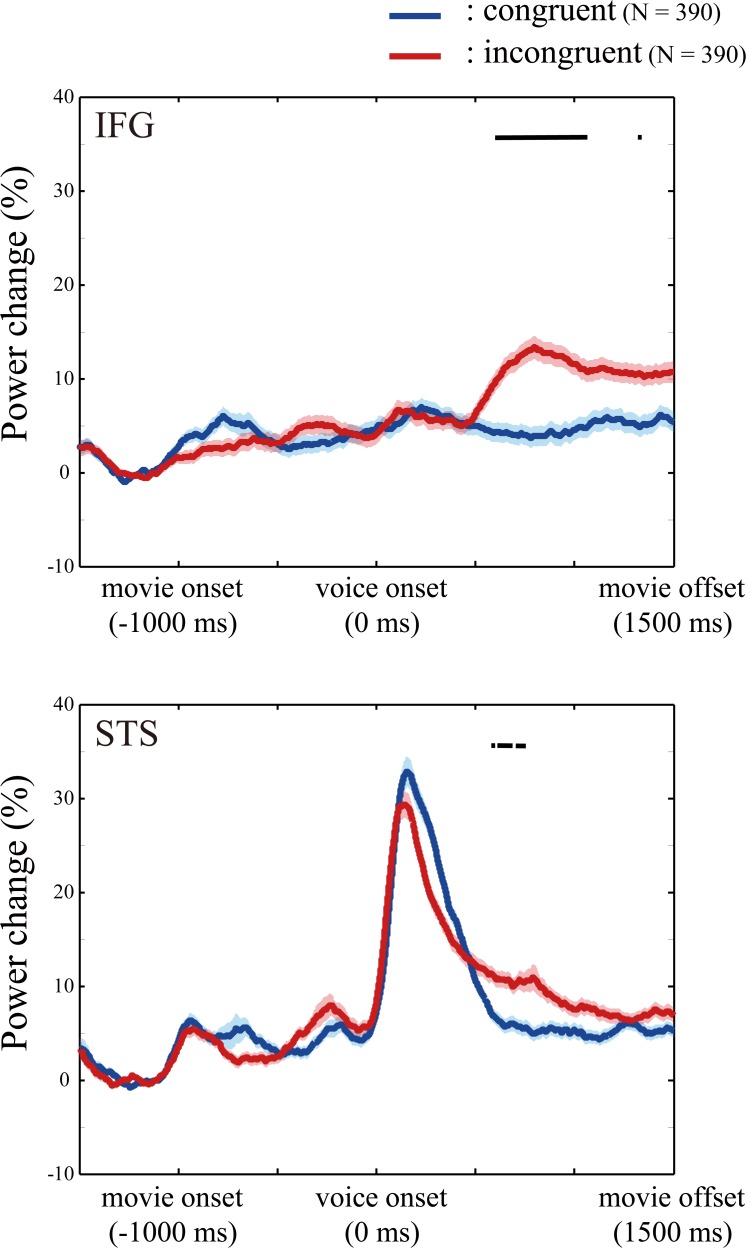
Fig 4. Temporal dynamics of high gamma activity (HGA).
The percentage changes of HGA in the inferior frontal gyrus and superior temporal sulcus are calculated in the congruent (blue) and incongruent (red) conditions, respectively. Shading means the standard error of mean. N represents the number of trials. The horizontal black bar indicates the epoch in which the increase in HGA was greater in the incongruent conditions than in the congruent condition (p < 0.0001). The results suggest that audiovisual mismatch increased HGA in later period (500–1000 ms after voice onset).

