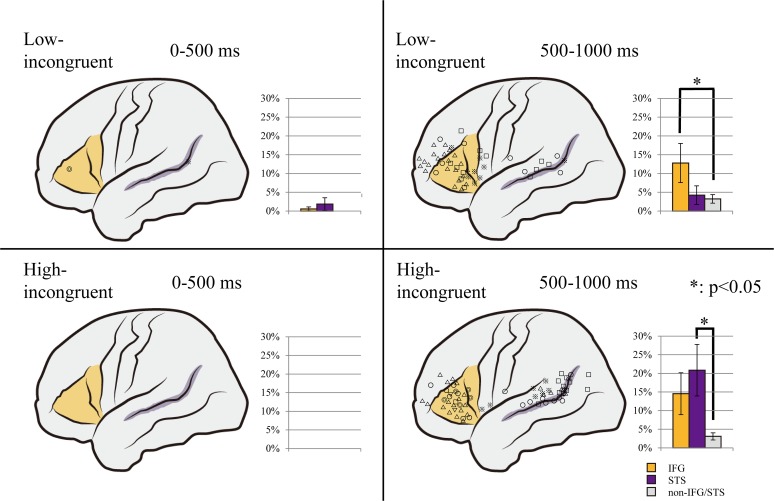
Fig 5. Distribution maps of the high gamma activity (HGA).
All the electrodes with a significantly greater HGA increase in the incongruent condition than in the congruent condition are shown on a template brain in the low-incongruent (upper) and high-incongruent (lower) conditions. The shapes of the electrode markers indicate individual patients. The bar charts beside the template brain image show the average percentage of electrodes that showed a significant HGA increase in the inferior frontal gyrus (IFG; orange), superior temporal sulcus (STS; purple), and other (gray) regions respectively. In the early period, in both the low- and high-incongruent conditions, only a few of the 1054 electrodes exhibited a significant HGA increase (left). In the later period, more electrodes showed a significant HGA increase. The increase was localized in the IFG in the low-incongruent condition (p = 0.0462; right upper) and in the STS in the high-incongruent condition (p = 0.0254; right lower). Error bars indicate standard error of the mean.

