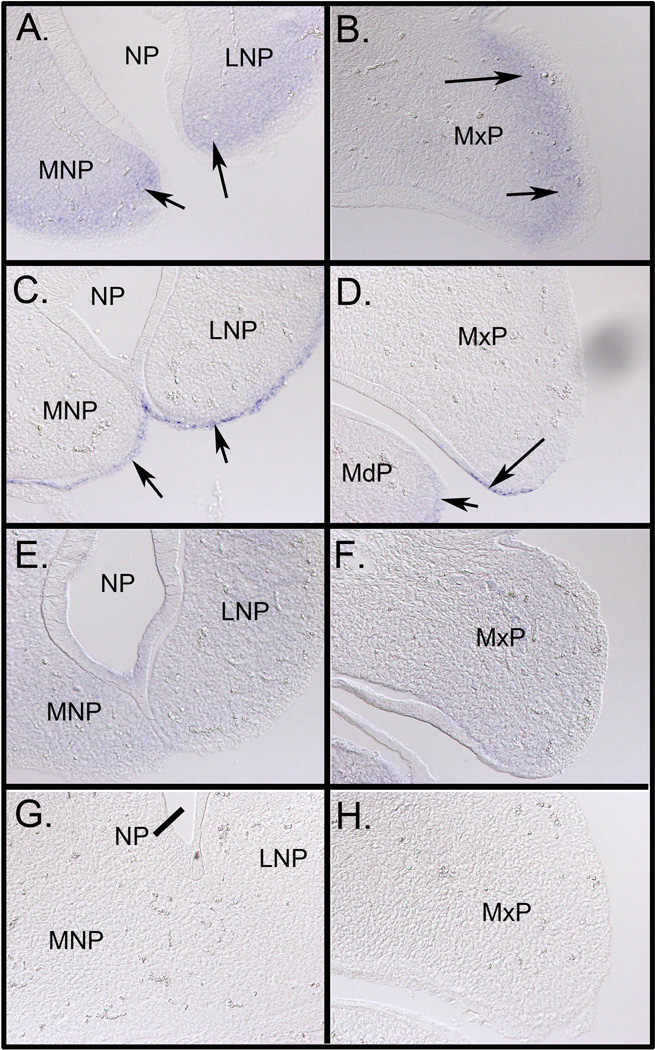
Figure 5. Expression of miR-199a-3p, miR-203, and Let-7i in GD11.5 mouse facial processes.
To determine the specific cellular expression pattern of each miR analyzed, the fetuses shown in Figure 3 were equilibrated in 30% sucrose/PBS, embedded and frozen in OCT medium, and sectioned at a thickness of 16 µm. Panel A shows the expression of miR-199a-3p in the mesenchyme of the MNP and LNP (arrows) and in the MxP (Panel B, arrows). Panels C and D reveal epithelium-specific expression of miR-203 in the MNP and LNP and MxP, respectively (arrows). Expression was also noted in the MdP (panel D, arrow). The expression of Let-7i was more uniform and widespread than that for miR-199a-3p and miR-203 (panels E and F). The negative control probe is shown in panels G and H. MNP, medial nasal process; LNP, lateral nasal process; MxP, maxillary and MdB, mandibular aspect of the first branchial arch; NP, nasal pit. All images were taken at 200X magnification.

