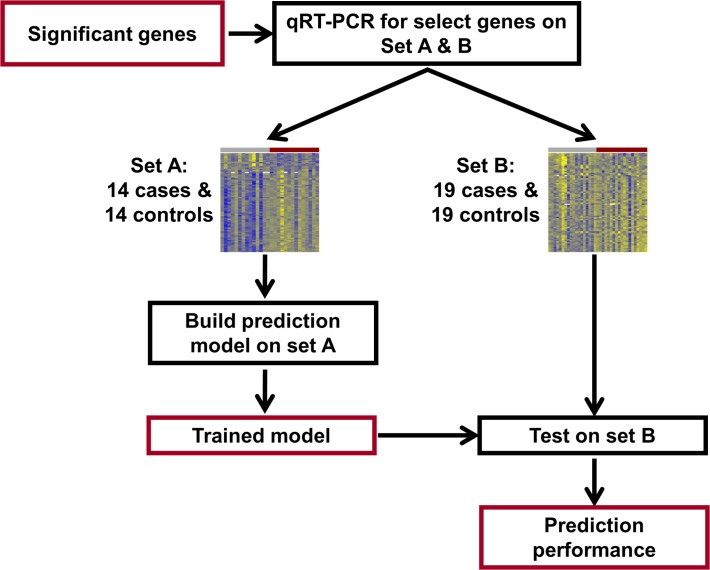
Fig 2. qRT-PCR study flow diagram.
Differentially expressed genes identified from the microarray study were profiled using qRT-PCR for validation and construction of a multi-gene disease classifier using an extended set of 33 cases and 33 controls. Set A was used to build the prediction model and then this model was tested on set B, consisting of 19 cases and 19 controls.

