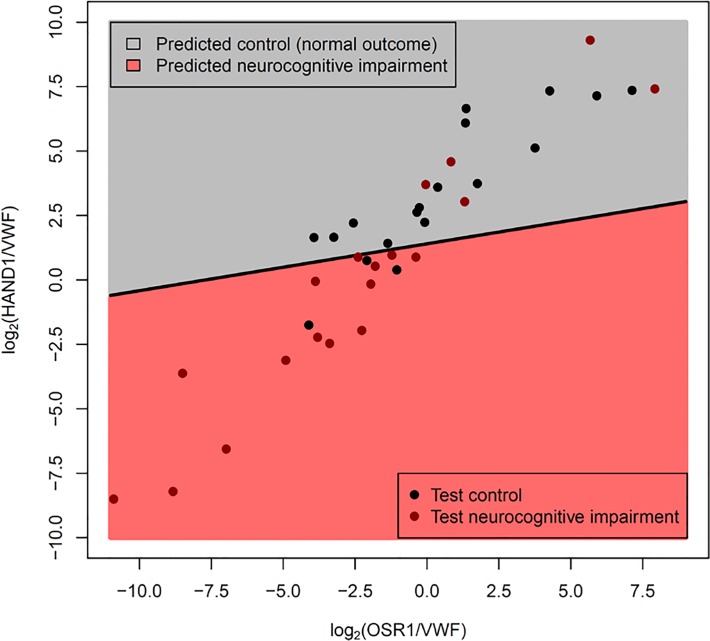
Fig 3. Gene expression-based classifier for neurocognitive impairment using OSR1/VWF and HAND1/VWF expression ratios.
The Fig. shows the linear discriminant model (see oblique black line) built using qRT-PCR measured expression data from the training set. Since −Ct values are surrogate for log2 gene abundance, differences in −Ct values of two genes is equivalent to their log2 expression ratios. Data are represented as log2 expression ratios (y-axis: −Ct HAND1 +Ct VWF; x-axis: −Ct OSR1 +Ct VWF). The dots represent data from patients from the test set. The model was tuned on the training data to yield a specificity of ∼85%. The actual performance on the test set was sensitivity of 74%, at specificity of 83%.

