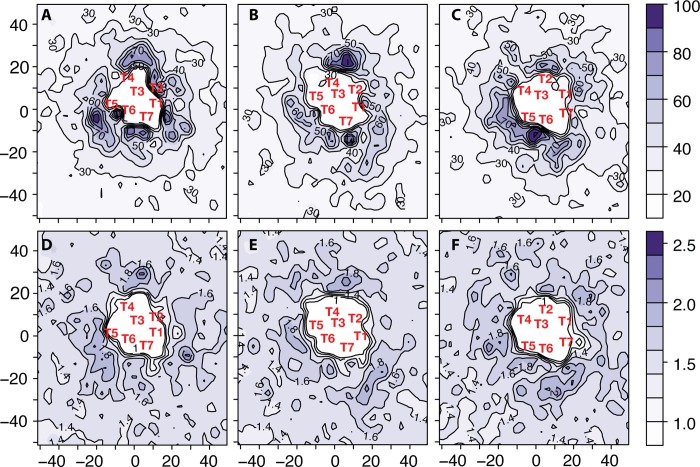
Fig 6. Persistence times and persistence-to-exchange time ratios of cholesterol molecules derived from the OR homo-dimer simulations.
Specifically, persistence times of cholesterol calculated for δ-OR/δ-OR, κ-OR/κ-OR, and μ-OR/μ-OR are reported, in ns, in panels A, B, and C, respectively. Persistence-to-exchange time ratios of cholesterol around isolated δ-OR, κ-OR, and μ-OR are shown in panels D, E, and F, respectively. Approximate locations of the centers of mass of the seven transmembrane helices (TM1-TM7) are indicated with red labels.

