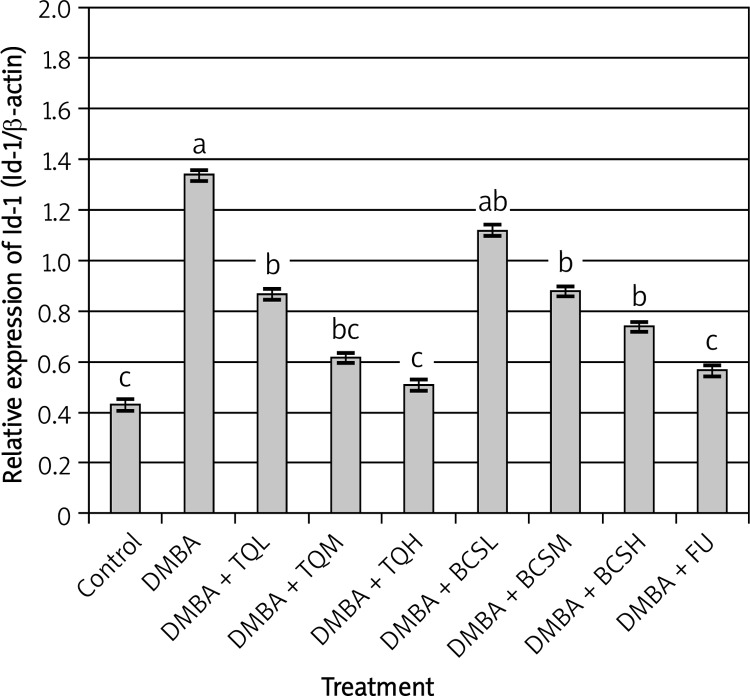
Figure 4.
Effect of TQ and BCS on the expression of Id-1 gene in mammary gland tissues of DMBA-treated rats using semi-quantitative real-time PCR analysis. Means showing different lettering (a, b, c) between columns differed significantly at p < 0.05. a p < 0.05 compared to control group, b p < 0.05 compared to DMBA group, c p < 0.05 compared to DMBA + TQ and BCS groups, respectively. Data were analyzed by ANOVA followed by Scheffe test

