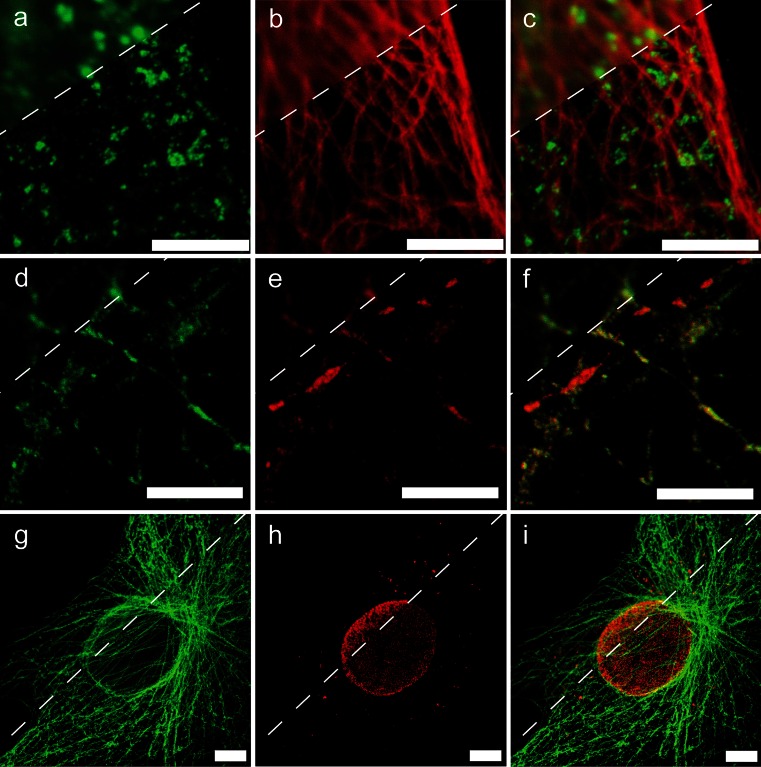
Fig. 3.
Three examples of multicolor STED imaging. a–f Images were acquired by a custom-made pulsed STED microscope based on a supercontinuum laser source (Galiani et al. 2012b). g–i Images were acquired by a standard commercial Leica TCS SP5 gated STED-CW microscope (Leica Microsystems, Mannheim, Germany). Top left corners Confocal image. Bottom right corners STED image. a–c Multicolor imaging of Hela cells in which clathrin is stained by ATTO 590 (green) and tubulin by ATTO647N (red). d–f Culture of hippocampal neurons in which SynI is labeled with ATTO 594 (green) and vGAT with Abberior STAR635p (red). Sample courtesy of Marta D’Orlando and Gabriele Lignani, Neuroscience and Brain Technologies, Istituto Italiano di Tecnologia, Genova, Italy. g–i Ptk2-cell in which microtubules are labeled by Alexa488 (green) and NUP153 by Abberior 440SX (red). a, d Excitation wavelength is 566 nm, STED wavelength is 715 nm, and collection spectral window is 570–640 nm. b, e Excitation wavelength is 640 nm, STED wavelength is 745 nm, and the collection spectral window is 650–690 nm. g, h Excitation wavelength is 470 and 488 nm, respectively, STED wavelength is 592 nm for both, the collection spectral window is 480–500 nm and 510–560 nm, respectively. c, f, i Color overlay of the respective images left. Bars 5 μm

