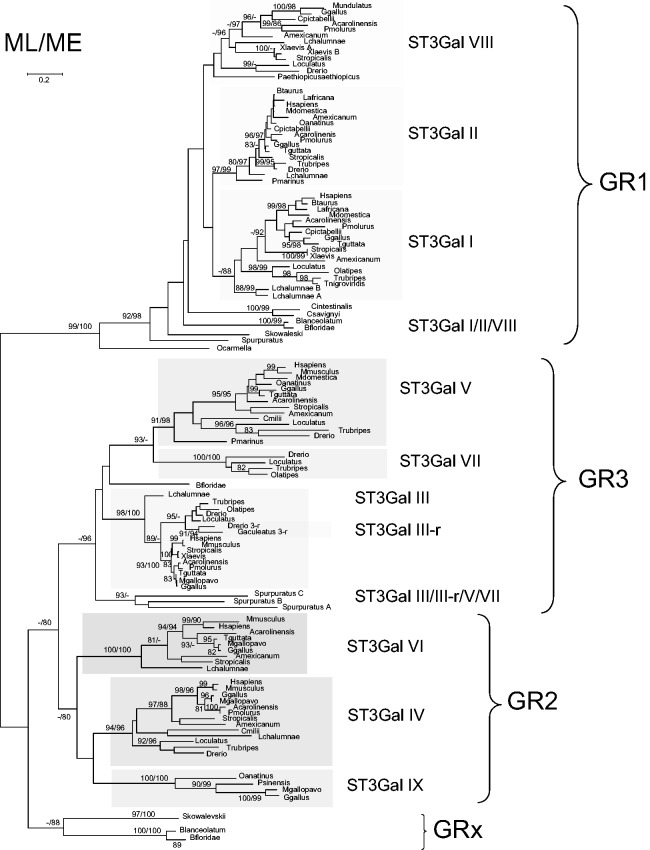
Fig. 1.
Maximum-likelihood phylogenetic tree of 121 sialyltransferases of the ST3Gal family. The tree with the highest log likelihood (−17,431.9308) is shown. A discrete Gamma distribution was used to model evolutionary rate differences among sites (five categories [+G, parameter = 1.1543]). The analysis involved 121 amino acid sequences. All positions with less than 95% site coverage were eliminated. There were a total of 228 positions in the final data set. Bootstrap values were calculated from 500 replicates and values greater than 80% are reported at the left of each divergence point. The bootstrap values indicated at the left correspond to ML and the right ones to ME.

