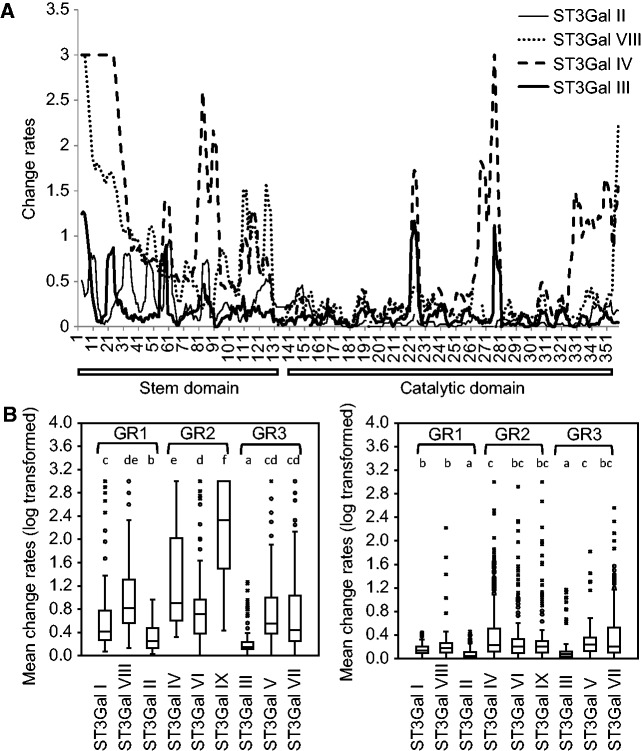
Fig. 2.
Substitution rates in vertebrate ST3Gal polypeptide sequence. (A) The transmembrane and cytoplasmic domains have been discarded from the analysis. For clarity of representation, the profiles of only four ST3Gal subfamilies are shown, that is, ST3Gal II, ST3Gal VIII, ST3Gal IV, and ST3Gal III. Position 1 corresponds to the first amino acid of the stem. (B) Comparisons of mean substitution rates of the metazoan ST3Gal. The left graph corresponds to the stem part and the right one to the catalytic domain. Fifty percent of values are comprised in the limits of boxes and the median is shown with a horizontal line inside the box. The different letters a–f correspond to significant differences (Tukey’s test on log-transformed substitution rates). The three groups of subfamilies GR1, GR2, and GR3 are in brackets.

