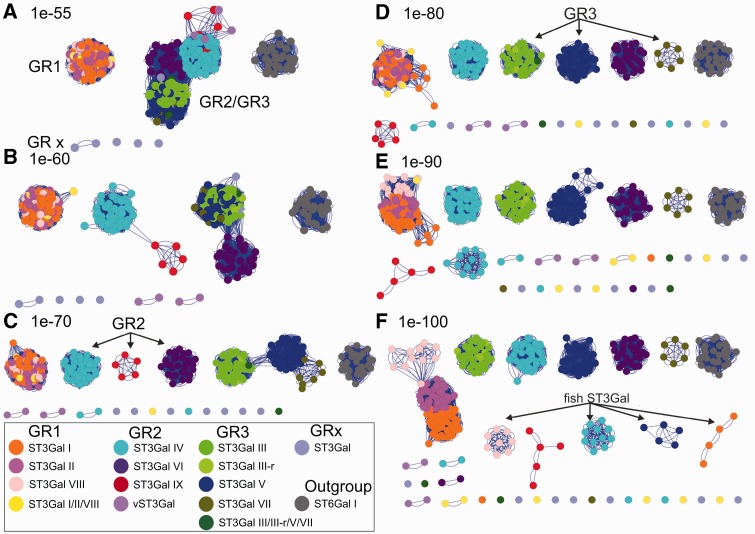
Fig. 3.
Sequence similarity network: The similarity network was constructed as described in Materials and Methods. It included 336 ST3Gal-related sequences identified from vertebrate and invertebrate genomes and 27 ST6Gal I sequences constituting an outgroup. The pairwise relationship between sequences was calculated by a BLASTall search in the custom database with each individual sequence in the set and the E value was taken as a measure of similarity between sequences. Thresholded similarity network represents sequences as nodes (circles) and all pairwise sequence relationships (alignments) better than an E value threshold as edges (lines) between nodes. The same network is shown here at six different thresholds, varying the cutoff value from permissive (A–C) to stringent (D–F). At a permissive E value thresholds 1e-55 (A) sequences belonging to GR2 and GR3 merge together, as the threshold is becoming more stringent and edges associate with more significant relationships, sequences break up into disconnected groups with high similarity within each group. Nodes were colored according to the subfamily to which the sequence belongs, either known (ST3Gal I–ST3Gal VI) or predicted (ST3Gal VII, ST3Gal VIII, and ST3Gal IX). Also ST3Gal-related sequences that belong to intermediate groups have been considerate separately, as invertebrate ST3Gal I/II/VIII, ST3Gal III/V/VII, ST3Gal IV/VI/IX, and ST3Gal III-r sequences, yielding in total to 14 different groups including the control group. The network was visualized using Cytoscape 2.8.3 version (Shannon et al. 2003), default Cytoscape force-directed layout was applied.

