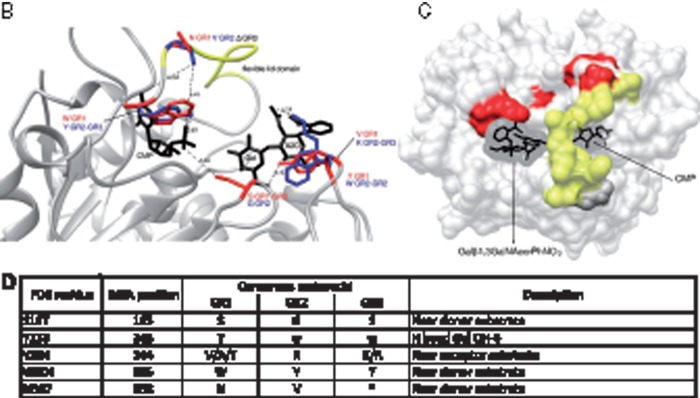
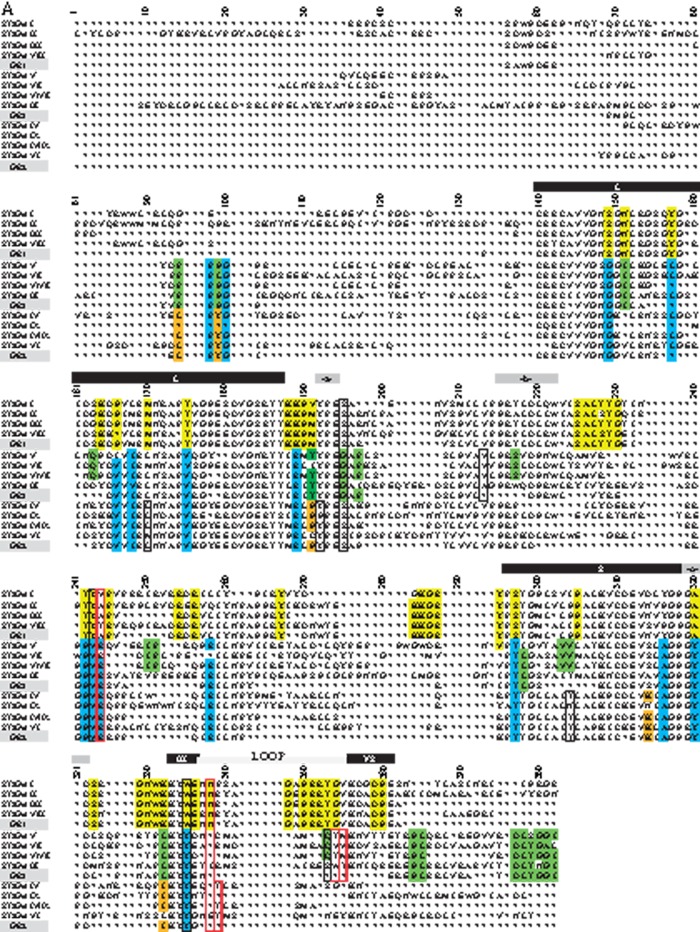
Fig. 5.

(A) Conservation of amino acid stretches in the vertebrate ST3Gal sequences evidenced by automatic conserved sequence searches. We assessed conservation of the 382 amino acid positions selected from the vertebrate ST3Gal sequences considered for phylogeny analyses (see tables S1 and S2, Supplementary Material online) using an automatic search of consensus sequences described in Materials and Method. For each subfamily, the consensus sequences were aligned with the one generated by MEGA 5.0. The resulting alignment is used to detect those positions called SDP that are conserved within groups of related proteins that perform the same function (specificity groups). SDP type I is variable in one group and conserved in the others, whereas type II positions show different conserved amino acids among the various groups of sequences. Amino acids residues belonging to conserved peptide sequences are shown. Amino acid positions with a yellow background identify conserved amino acid for the α2,3-sialyltransferase-related sequences of the GR1 group, with a green background those of the GR3 (especially the ST3Gal V–VII), with an orange background, those of the GR2, and with a blue background, those of the GR2 and GR3. The sialylmotifs L, S, III, and VS are indicated in black background, and the specific motifs to ST3Gal family –a-, -b- and –c-, in gray background. The positions are numbered from the beginning of the stem, excluding the N-terminus and the transmembrane domain. SDP prediction for GR1, GR2, and GR3 groups. (B) Representation of five SDPs located nearby the active site is represented in the reference structure (PDB: 2WNB). The modeled lid domain is shown in yellow, donor and acceptor substrates are shown in black stick representation, SDPs are shown in red or blue stick, the label indicates the conserved amino acid and the corresponding group (i.e., near CMP a W is conserved in GR1 and it is represented in red, whereas a Y is conserved in GR2 and GR3 at the same position, which is represented in blue).When there is no conserved residue in a group, the position is labeled as Δ in black. (C) SDP in surface representation of the reference structure (PDB: 2WNB). The modeled lid domain is highlighted in yellow, SDP predicted in red, the donor and acceptor substrate are shown in black. Note that the lid domain flexibility can alter the binding site of both substrates, and also the amino acid change in the SDP. (D) Table summarizing SDPs information. First column indicates the corresponding position in the reference structure (PDB: 2WNB); second column the position in the MSA, the third the most conserved residues for each group, the * indicates variable position; in the last column is entered a description that can be related to the function of the position.

