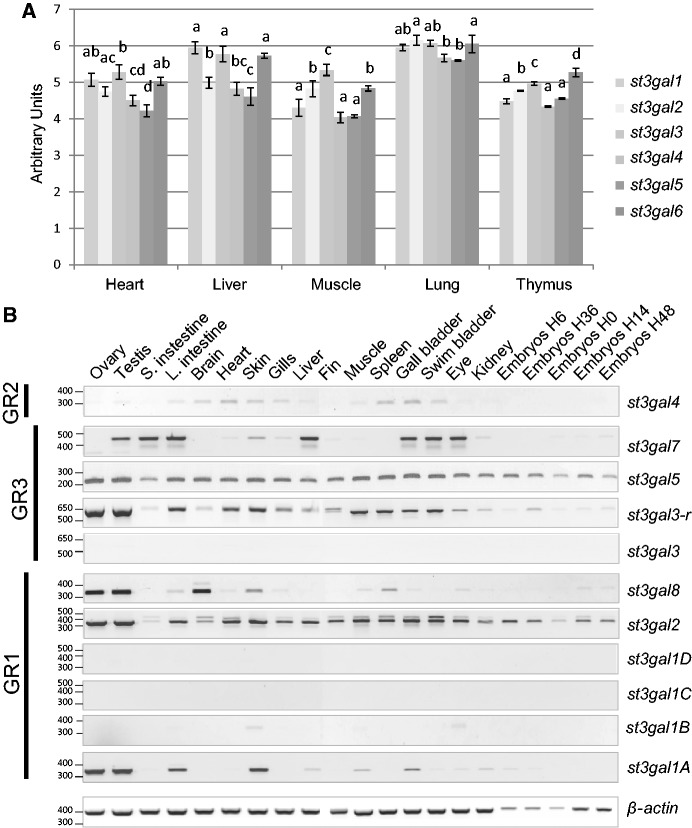
Fig. 7.
Expression pattern of st3gal genes in two model organisms. (A) Expression pattern of bovine st3gal genes in five adult tissues using TLDA approach. Total RNA was extracted from heart, liver, muscle, lung and thymus and retrotranscribed. TLDA was carried out as described in Materials and Methods. The different letters a–d corresponded to significantly different expressions per tissue (ANOVAs on five independent individuals). (B) Expression pattern of the zebrafish st3gal genes in various adult tissues using RT-PCR. Relative expression levels of zebrafish st3gal and β-actin mRNA were evaluated by RT-PCR as described in Materials and Methods, among various zebrafish adult tissues. Oligonucleotide primer sequence specific of each zebrafish st3gal gene is already described in Vanbeselaere et al. (2012). The zebrafish β-actin (378 bp) was amplified as a control of cDNA synthesis and purity. Data gathered each group of st3gal genes, that is, GR1, GR2, and GR3.

