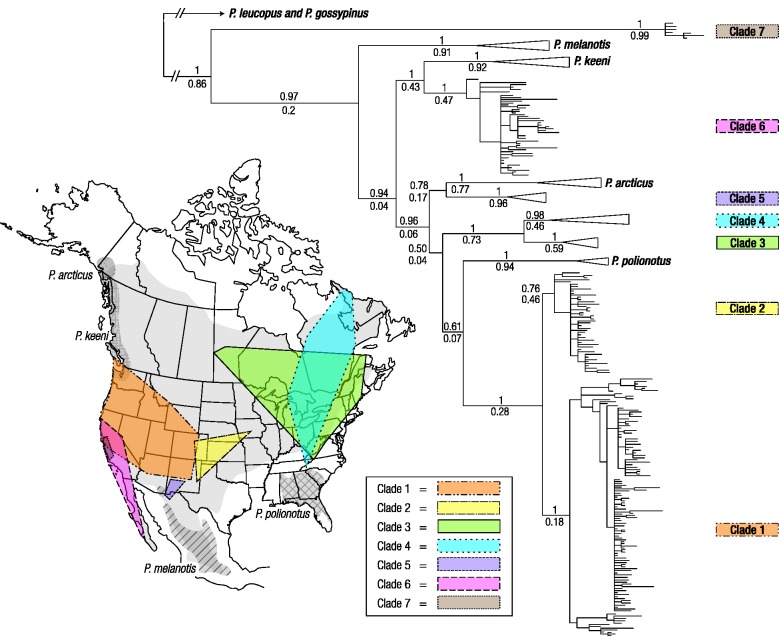
Fig. 2.
Bayesian phylogeny of cytb sequences from 454 specimens of Peromyscus maniculatus and closely related species based on a GTR+I+G model of nucleotide substitution. Bayesian posterior probabilities (above) and maximum-likelihood bootstrap support values (below) are shown for all major nodes in the tree. The inset map of North America shows the geographic range of P. maniculatus and the superimposed distributions of seven main cytb clades. There is a broad zone of admixture between two highly distinct phylogroups (clades 1 and 6) that extends from coastal California to the western periphery of the Great Basin. Consequently, cytb sequences from northern Californian mice are distributed between clade 1 (which includes specimens from geographically disparate high-altitude localities across the western United States) and clade 6 (see supplementary fig. S2, Supplementary Material online). Also shown are geographic distributions of four other Peromyscus species (P. arcticus, P. keeni, P. melanotis, and P. polionotus) that are paraphyletic relative to P. maniculatus in the cytb phylogeny.

