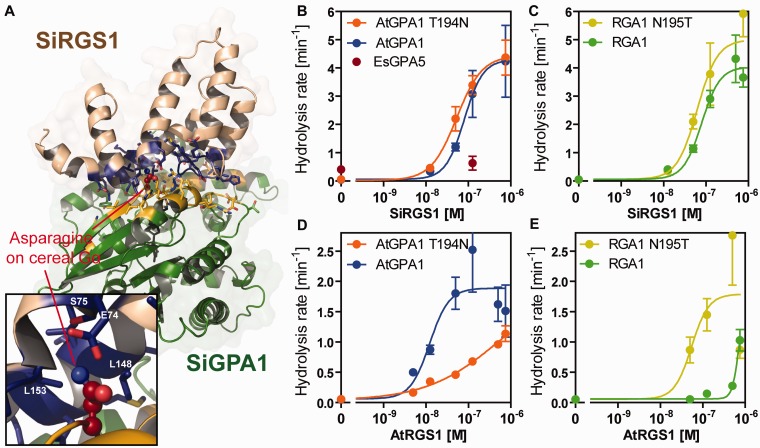
Fig. 2.
In vitro GAP activity of SiRGS1 protein. (A) Modeled-structure of Setaria italica Gα–RGS complex. Gα and SiRGS1 are shown in green and light brown, respectively. The contact residues are shown with side chains in yellow (SiGPA1) and blue (SiRGS1). A close-up view shows Asn195 of SiGPA1 and the contact residues. The Asn195-contacting residues are labeled. (B, C) GAP activity of SiRGS1 on AtGPA1, AtGPA1-T194N, RGA1, and RGA1-N195T proteins. Rates for GTP hydrolysis by 200 nM Gα proteins were determined using the One-Phase association model in Prism 5.0 software with single-turnover kinetics data shown in supplementary figure S2, Supplementary Material online. The catalytic rate constant of hydrolysis (kcat, min−1) was plotted against concentrations of SiRGS1 with standard errors obtained from seven or more data points of at least two experiments. (D, E) GAP activity of Arabidopsis thaliana AtRGS1. The dose–response curves were calculated using kinetics data published previously (Urano et al. 2012). The hydrolysis rates are shown in supplementary table S1, Supplementary Material online.

