Fig. 3.
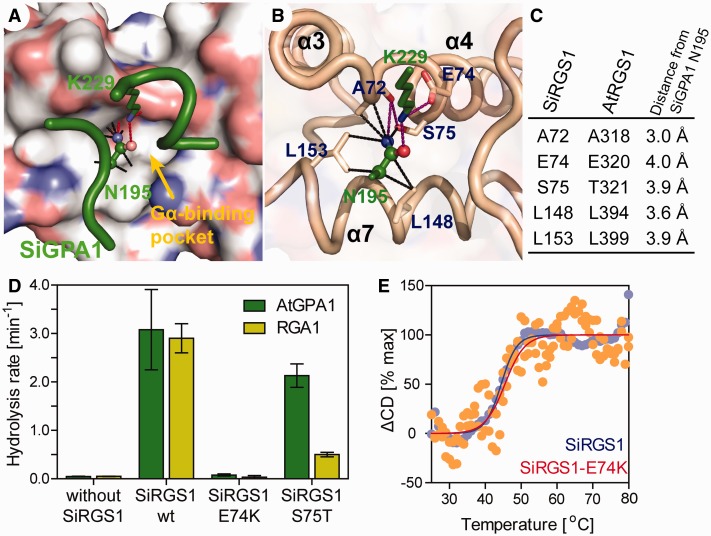
Mutational analyses of SiRGS1. (A, B) A modeled structure of SiRGS1 docked with SiGPA-Asn195 and -Lys229 residues (green). (A) Nitrogen and oxygen on the SiRGS1 surface are shown in blue and red. A yellow arrow indicates the Gα-binding pivot of SiRGS1 that docks the Asn195 of SiGPA1. Black dot lines connect a side chain of SiGPA1–Asn195 with SiRGS1 atoms within 4 Å. Purple lines indicate potential hydrogen bonds. (C) List of SiRGS1 residues located within 4 Å of a side chain of SiGPA1–Asn195. Corresponding residues of AtRGS1 and distance from SiGPA1–Asn195 are shown. (D) Hydrolysis rates of AtGPA1 and RGA1 with 125 nM SiRGS1 or SiRGS1 S75T, or 500 nM SiRGS1 E74K mutant protein. The hydrolysis rates and standard error of mean were estimated by single-turnover [32P]-GTP hydrolysis assays as shown in supplementary figure S2, Supplementary Material online. (E) Thermal stabilities of SiRGS1 and the SiRGS1-E74K mutant were determined from the change in CD values at 222 nm. The fraction of unfolded protein (ΔCD) was calculated as described in Materials and Methods.

