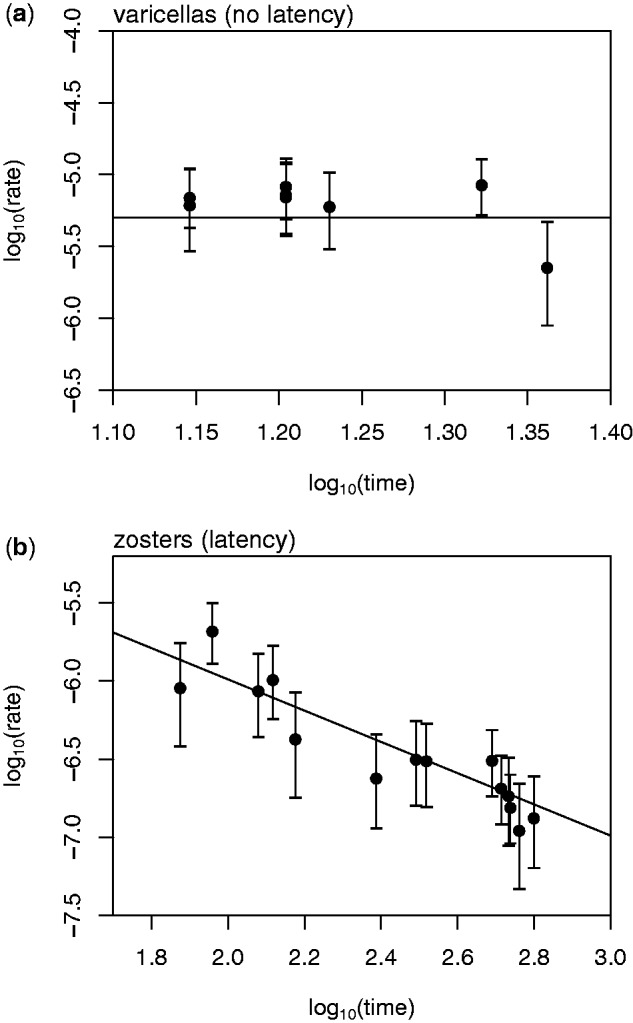
Fig. 2.

Estimated rates of evolution (substitutions/site/day) for each of the 22 strains of VZV sampled from vaccinated patients. Estimated rates are plotted against the length of time (days) between vaccination and sampling, which followed the appearance of symptoms. Panel (a) shows the eight patients who developed varicella rashes, with the horizontal line showing the maximum-likelihood rate for the whole data set. Panel (b) shows the 14 patients who developed herpes zoster rashes, with a line with a slope of −1, suggesting that the amount, but not the rate, of evolution is roughly constant in all strains.
