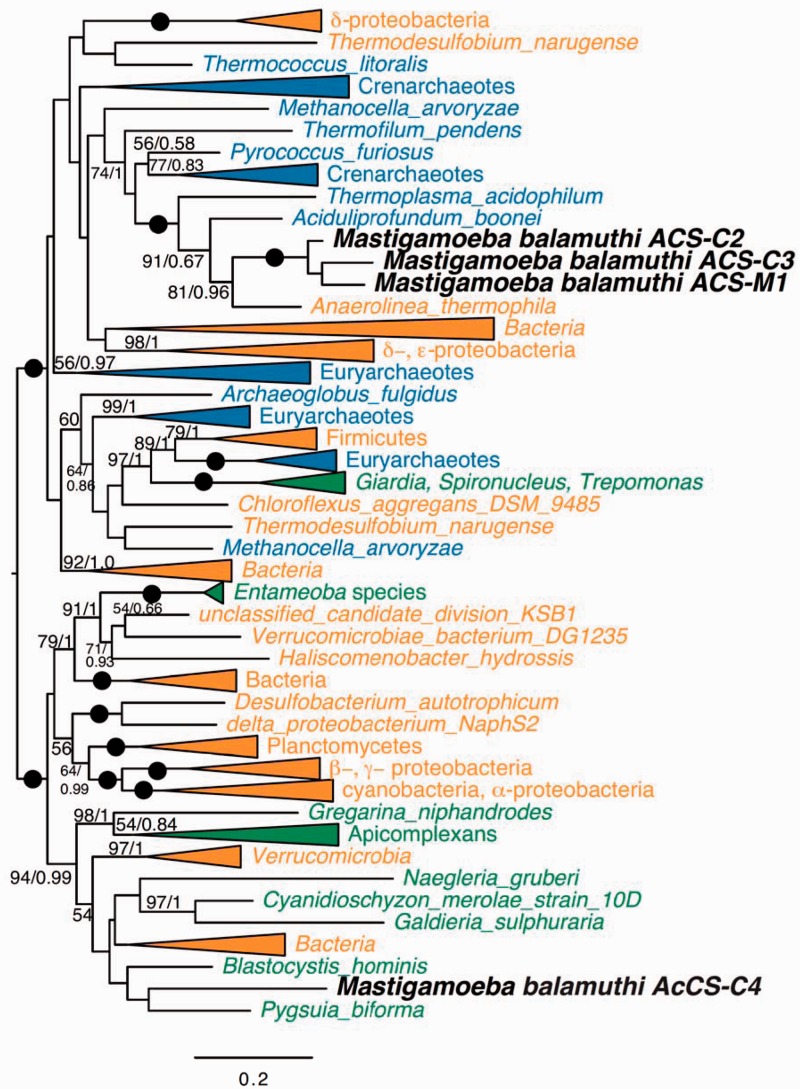
Fig. 5.
Phylogeny of ACS. ML tree of ACS (187 taxa and 497 sites). Bootstrap support (BP) and PP values were calculated for each branch using RAxML and PhyloBayes, respectively. Only BV and PP values greater than 50% and 0.5, respectively, are shown. Branches with maximum support (BV = 100%; PP = 1.0) are depicted using black circles. Bacterial and archaeal clades are shown in blue and orange, respectively.

