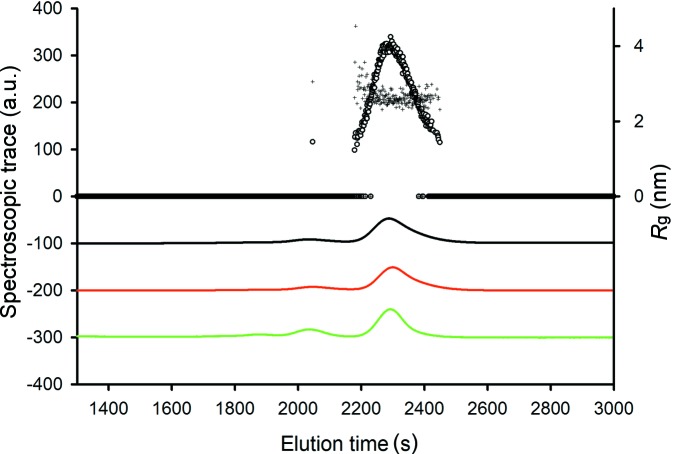
Figure 5.
Spectroscopic signal and SAXS-derived parameters collected after the size-exclusion column. The black line corresponds to the UV signal, the red line corresponds to the refractive index and the green line corresponds to the right-angle light scattering. The signals are in arbitrary units and have been offset for clarity. Forward scattering (○) and radius of gyration (+) were computed from the buffer subtracted curves.

