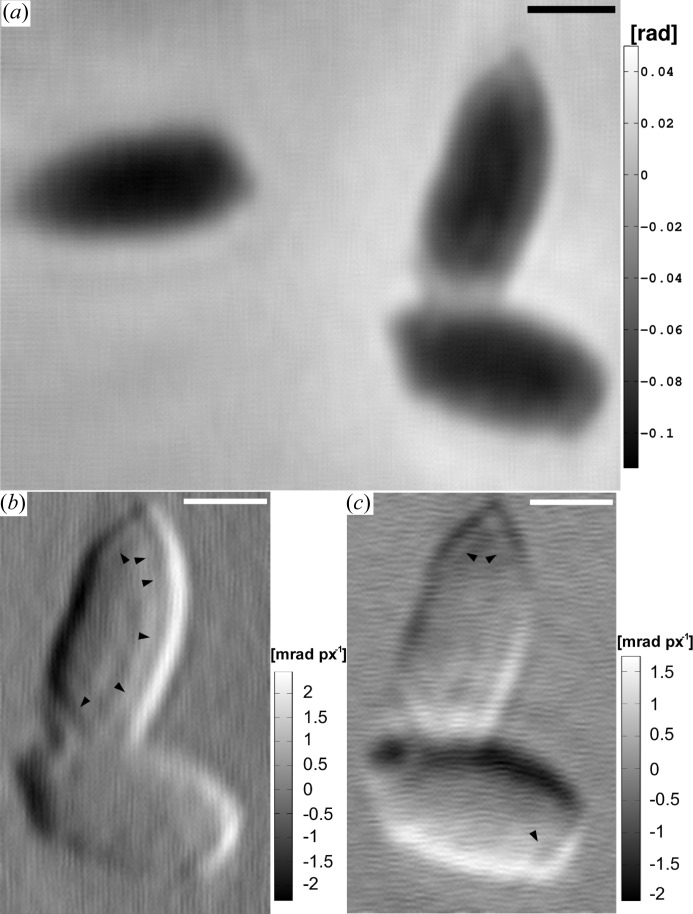
Figure 10.
(a) The CTF-based reconstruction of region (A) of the B. subtilis sample. Three isolated endospores can be seen. (b), (c) Calculated gradients (filtered with  pixel Gaussian) in the horizontal and vertical directions of the region of two endospores of (a). The black arrow heads highlight the transition between two different structural regions of the endospore that are attributed to the coat and the inner part. The repetitive structure on the gradient maps is an artefact of the reconstruction in (a). The scale bars denotes 0.5 µm.

